الوصف
متجر Pinescritlabs Ctrader المؤشرات :
هيكل السوق الديناميكي
تحليل نقاط الانعطاف
فيبوناتشي الخطي
انحدار متعدد الأطر الزمنية
انحياز الشمعة متعدد المستويات
المتعقب
دعم تلقائي و
خطوط اتجاه المقاومة
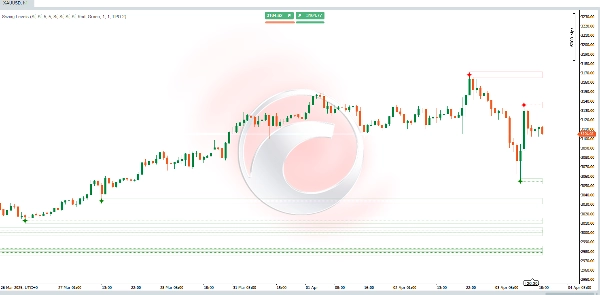
🔍 مستويات التأرجح
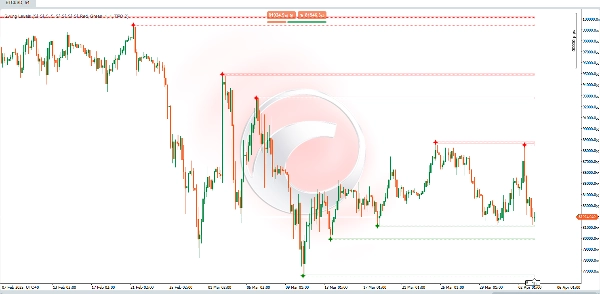
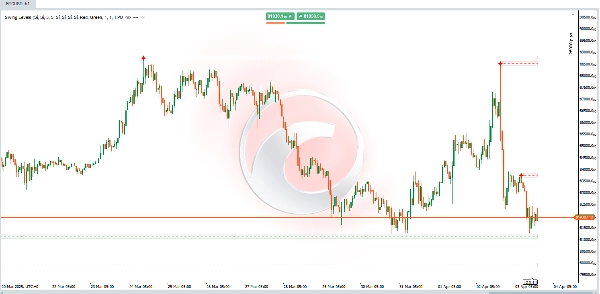
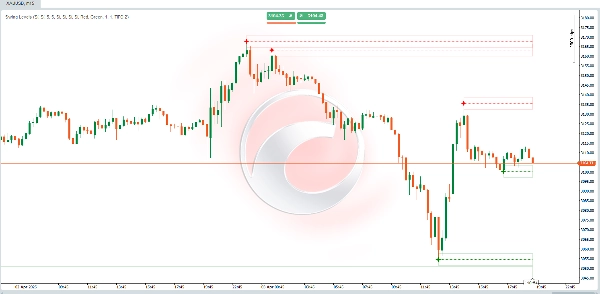
تم تصميم هذا المؤشر لكشف تلقائي عن مستويات الدعم والمقاومة بناءً على "التأرجحات" أو النقاط المحورية في الرسم البياني (أي القمم والقيعان المهمة). بمجرد تحديد هذه النقاط، يرسم خطوطًا أو مناطق (مستطيلات) التي تعمل كمراجع رئيسية لتحركات السعر وقرارات التداول.
🛠 الميزات الرئيسية:
✅ تحديد المستويات الرئيسية: يبرز الأماكن التي تشكلت فيها أحدث قمم التأرجح و قيعان التأرجح. غالبًا ما تعمل هذه المستويات كدعم أو مقاومة في المستقبل.
✅ تحليل هيكل السوق: يساعد على تصور ما إذا كان السوق يشكل قممًا أعلى وقيعانًا أعلى (صاعد) أو قممًا أدنى وقيعانًا أدنى (هابط)— وهو أمر أساسي لتحديد الاتجاه ونقاط الانعكاس المحتملة.
✅ أداة اتخاذ القرار: يمكن للمتداولين استخدام هذه المستويات لتحديد نقاط الدخول، مواضع وقف الخسارة، أو مناطق جني الأرباح، مستفيدين من الدعم والمقاومة الديناميكيين.
🧠 كيف يعمل؟
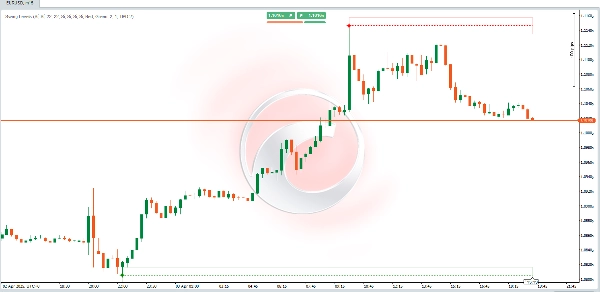
1️⃣ كشف النقاط المحورية (قمة التأرجح وقاع التأرجح)
📌 يحلل المؤشر عددًا محددًا من الشموع/الأشرطة إلى اليسار واليمين (المعلمات: "الأشرطة اليسارية" و "الأشرطة اليمنية").
📌 للكشف عن قمة تأرجح، يتحقق مما إذا كان ارتفاع الشمعة المركزية (النقطة المحورية المحتملة) أعلى من ارتفاعات الأشرطة المجاورة ضمن النطاق.
📌 للكشف عن قاع تأرجح، يطبق نفس المنطق لكنه يقارن القيعان بدلاً من ذلك.
📊 تفسير المستويات المرسومة:
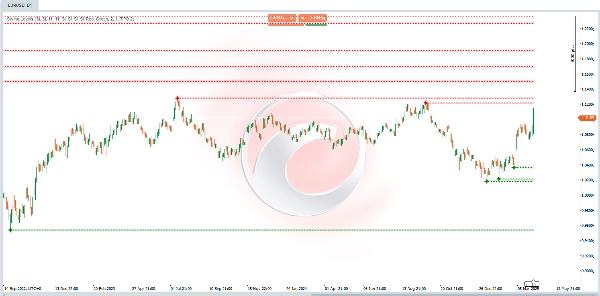
🔴 قمم التأرجح → مناطق مقاومة محتملة:
- إذا عاد السعر إلى هذا المستوى، راقب الرفض (البيع) أو اختراق (استمرار صاعد).
🟢 قيعان التأرجح → مناطق دعم محتملة:
- إذا أعاد السعر زيارة هذا المستوى، راقب الارتداد (الشراء) أو اختراق هابط (استمرار هبوطي).
الملخص
Key features include:
- Identification of recent swing highs and lows, which often act as future support or resistance.
- Visualization of market structure by highlighting patterns of higher highs and lows (bullish) or lower highs and lows (bearish), aiding trend recognition and reversal detection.
- A decision-making tool for traders to set entry points, stop-losses, and take-profit zones based on dynamic support and resistance.
Swing highs indicate potential resistance zones where price may reject or break out, while swing lows indicate potential support zones where price may bounce or break down. This indicator supports analysis across various markets and timeframes by providing clear visual cues of market turning points.
تقييمات العملاء
5 | 0 % | |
4 | 100 % | |
3 | 0 % | |
2 | 0 % | |
1 | 0 % |