คำอธิบาย
ค่าเฉลี่ยเคลื่อนที่แบบปรับตามประสิทธิภาพที่ปรับความเร็วในการทำให้เรียบอย่างไดนามิกตามสภาพตลาด
คำนวณการทำให้เรียบผ่านอัตราส่วนประสิทธิภาพ (การเคลื่อนไหวเชิงทิศทางเทียบกับความผันผวนทั้งหมด) ตอบสนองอย่างรวดเร็วในแนวโน้มและแบนราบในช่วงเสียงรบกวนเพื่อหลีกเลี่ยงการแกว่งตัว
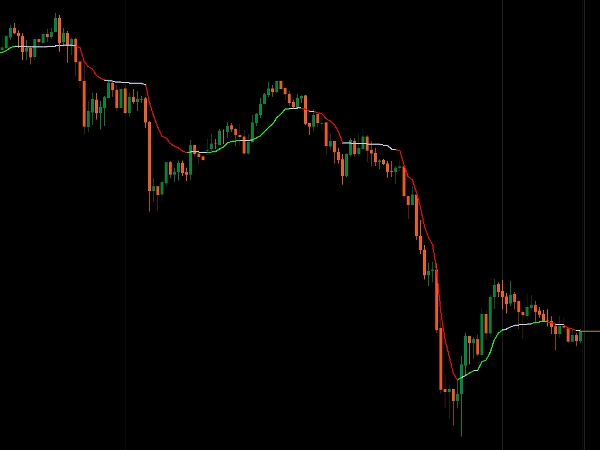
การแสดงผลสีสามสถานะ (แนวโน้มขาขึ้นสีเขียว, แนวโน้มขาลงสีแดง, ช่วงเคลื่อนไหวสีฟ้าอ่อน), พารามิเตอร์ความไวที่ปรับได้ (ช่วงเวลา, การทำให้เรียบเร็ว/ช้า, เกณฑ์ ER), การสลับอัตโนมัติระหว่างโหมดเร็วและช้า และพฤติกรรมแนวรับ/แนวต้านแบบไดนามิก มอบการติดตามแนวโน้มที่ปรับตัวได้สำหรับผู้เทรดที่ต้องการความตอบสนองในตลาดเชิงทิศทางและความมั่นคงในช่วงรวมตัว
คุณสมบัติ
อัลกอริทึมปรับตัว
- ความเร็วในการทำให้เรียบเปลี่ยนแปลงตามอัตราส่วนประสิทธิภาพ (ER)—อัตราส่วนของการเคลื่อนไหวเชิงทิศทางต่อความผันผวนทั้งหมด
- ตอบสนองอย่างรวดเร็วเมื่อประสิทธิภาพเพิ่มขึ้น
- แบนราบเมื่อราคามีเสียงรบกวนเพื่อหลีกเลี่ยงการแกว่งตัว
- ระยะทางไดนามิกจากราคาโดยอิงจากพฤติกรรมตลาด
การแสดงผลสามสถานะ
- สีเขียว: แนวโน้มขาขึ้นแข็งแกร่ง (ER เหนือเกณฑ์ + กำลังเพิ่มขึ้น)
- สีแดง: แนวโน้มขาลงแข็งแกร่ง (ER เหนือเกณฑ์ + กำลังลดลง)
- สีฟ้าอ่อน: ช่วงเคลื่อนไหว/แกว่งตัว (ER ต่ำกว่าเกณฑ์)
- ยืนยันสภาพตลาดทันทีด้วยภาพ
ความไวที่ปรับได้
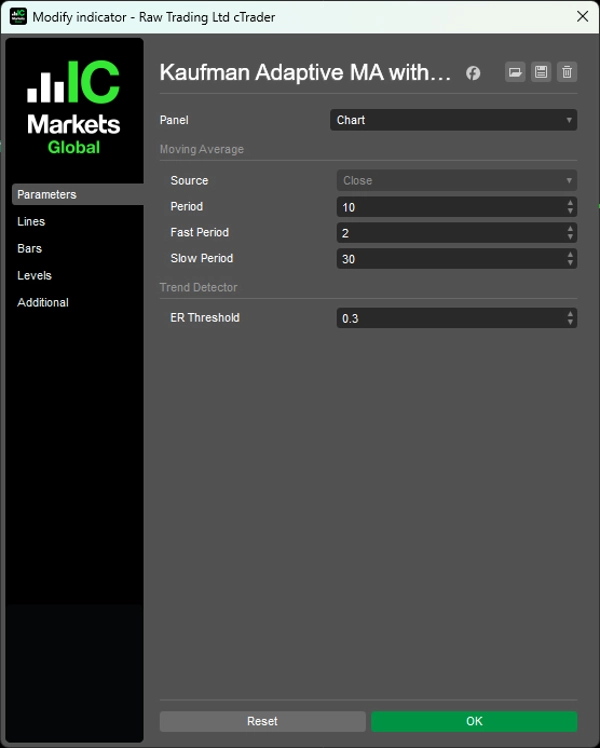
- ช่วงเวลา: การย้อนดูเพื่อคำนวณประสิทธิภาพ (ค่าเริ่มต้น: 10)
- ช่วงเวลารวดเร็ว: การทำให้เรียบในแนวโน้มแข็งแกร่ง (ค่าเริ่มต้น: 2)
- ช่วงเวลาช้า: การทำให้เรียบในตลาดช่วงเคลื่อนไหว (ค่าเริ่มต้น: 30)
- เกณฑ์ ER: ประสิทธิภาพขั้นต่ำเพื่อให้ถือว่าเป็นแนวโน้ม (ค่าเริ่มต้น: 0.3)
การปรับตัวอัจฉริยะ
- สลับอัตโนมัติระหว่างการทำให้เรียบเร็วและช้า
- กรองเสียงรบกวนในตลาดที่แกว่งตัว
- จับแนวโน้มได้เร็วเมื่อสภาพเปลี่ยนแปลง
- ทำงานเป็นแนวรับ/แนวต้านแบบไดนามิก
__________________________________________________________________________________________
ตัวชี้วัดฟรีเพิ่มเติม
สำรวจเครื่องมือวิเคราะห์ตลาดหลากหลายประเภท—ตั้งแต่โครงสร้างและปริมาณไปจนถึงการถดถอย, ความผันผวน และกรอบเวลาที่กำหนดเอง
ซอร์สโค้ดมีให้บน GitHub repository.
ทั้งหมดใช้ฟรี แต่ถ้าคุณต้องการสนับสนุนด้วยกาแฟ คุณสามารถส่งได้ ที่นี่.
แนวรับ/แนวต้าน
ปริมาณ
- Volume Activity Profiler
- Volume Efficiency Analyzer
- Volume Profile Analytics
- Volume Profile - Updated
- Volume Spread Analysis
- VWAP (Volume Weighted Average Price)
ค่าเฉลี่ยเคลื่อนที่
- SSL Channel
- Anchored Moving Average
- Deviation-Scaled Moving Average
- Gann High Low Activator
- Instantaneous Trendline
- Kaufman Adaptive MA with Trend Vision
- Moving Average Channel
- Moving Averages Suite
- Trend Channel Moving Average
ยูทิลิตี้/กำหนดเอง
อิงการถดถอย
ความผันผวน
ออสซิลเลเตอร์
__________________________________________________________________________________________
ข้อจำกัดความรับผิดชอบ
การเทรดมีความเสี่ยง ตัวชี้วัดนี้มีไว้สำหรับการวิเคราะห์ทางเทคนิคเท่านั้น — โปรดใช้การบริหารความเสี่ยงอย่างเหมาะสมและเทรดอย่างรับผิดชอบเสมอ
ข้อเสนอแนะ & การปรับปรุง
หากคุณมีข้อเสนอแนะ คำขอคุณสมบัติ หรือไอเดียสำหรับการปรับปรุง กรุณาแสดงความคิดเห็นในแท็บ Discussion ข้อเสนอแนะของคุณช่วยปรับปรุงตัวชี้วัดให้ดียิ่งขึ้นสำหรับทุกคน
สรุป
Key features include a three-state color-coded visualization: green for strong uptrends, red for strong downtrends, and light blue for ranging or choppy markets, providing immediate visual insight into market states. Users can configure sensitivity parameters such as lookback period, fast and slow smoothing periods, and the ER threshold to tailor responsiveness.
The indicator automatically switches between fast and slow smoothing modes, adapting to changing market behavior. It also acts as a dynamic support and resistance tool, helping traders identify trend shifts early while filtering out noise in consolidation phases. This adaptive approach supports scalping and other trading strategies requiring both responsiveness and stability in directional and ranging markets.