설명
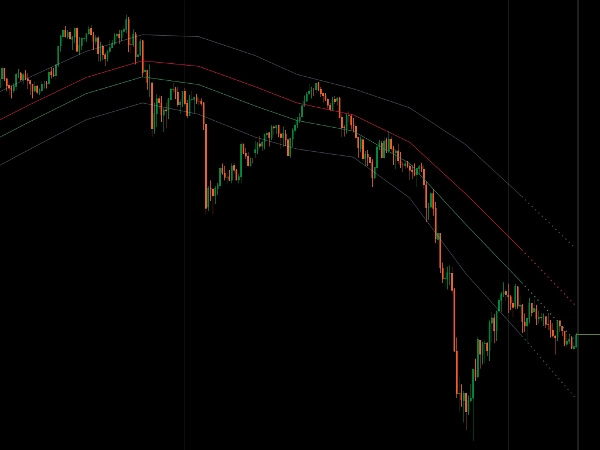
모든 네 가지 OHLC 가격에 이동 평균을 사용하여 완전한 시장 구조 분석을 위한 동적 가격 채널.
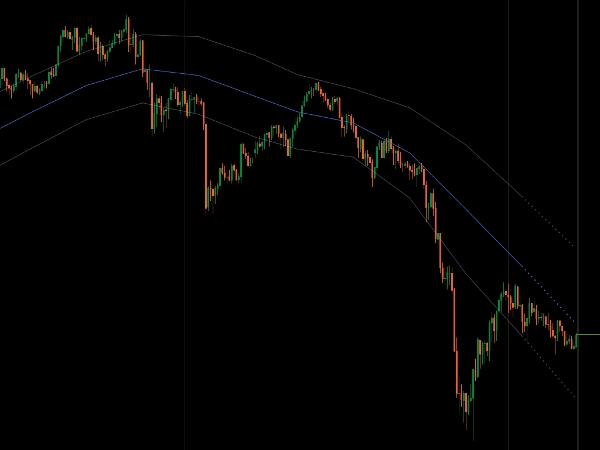
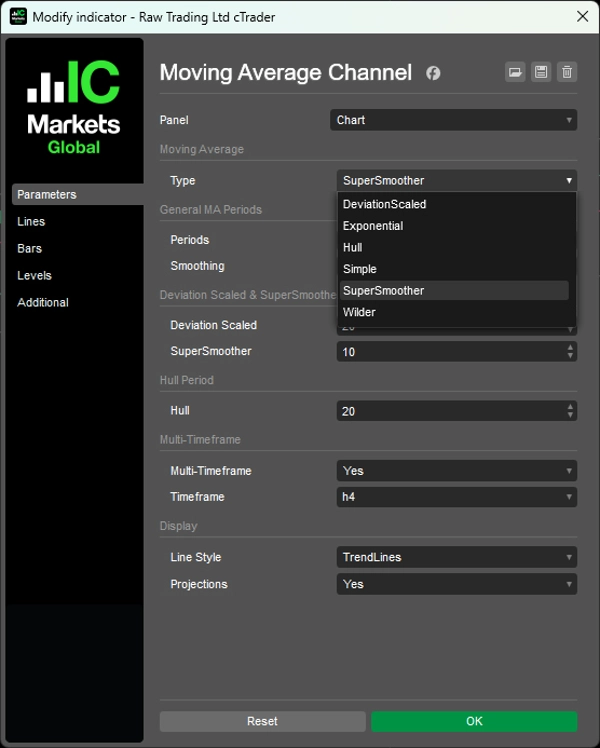
선택한 MA 유형(단순, 지수, 와일더, 편차 스케일, 슈퍼스무더, 헐)을 고가/저가 경계, 시가/종가 방향 편향, 중간 균형선에 적용하여 일관된 채널 시각화를 제공합니다.
내장된 피보나치 반전 구역(38.2%, 61.8%), SMA/EMA를 위한 이중 스무딩 레이어로 매우 깔끔한 채널 생성, 전통적인 계단식 또는 대각선 추세선 모드의 다중 시간 프레임 표시, 스마트 모멘텀 기반 예측 및 경계 반발 감지 기능으로 평균 반전 및 추세 강도 평가를 위한 포괄적인 채널 구조를 제공합니다.
특징
완전한 가격 구조
- 고가/저가가 채널 경계를 정의합니다
- 시가/종가가 방향 편향을 보여줍니다
- 중간선: 고가/저가 사이의 50% 수준 — 시장 균형의 진정한 중심
- 네 가지 가격이 함께 작동하여 완전한 시장 그림을 보여줍니다
내장된 반전 구역
- 피보나치 38.2% 및 61.8% 수준이 통계적으로 중요한 되돌림 영역을 표시합니다
- 가격 움직임에 따라 적응하는 동적 구역
- 명확한 진입 및 퇴장 기준점
6가지 이동 평균 유형
- 단순, 지수, 와일더, 편차 스케일, 슈퍼스무더, 헐
- SMA/EMA를 위한 이중 스무딩: 기간 + 추가 스무딩 레이어로 매우 깔끔한 채널 생성
- 고급 알고리즘: 편차 스케일은 변동성에 적응, 슈퍼스무더는 지연 제거, 헐은 최근 가격 움직임 강조
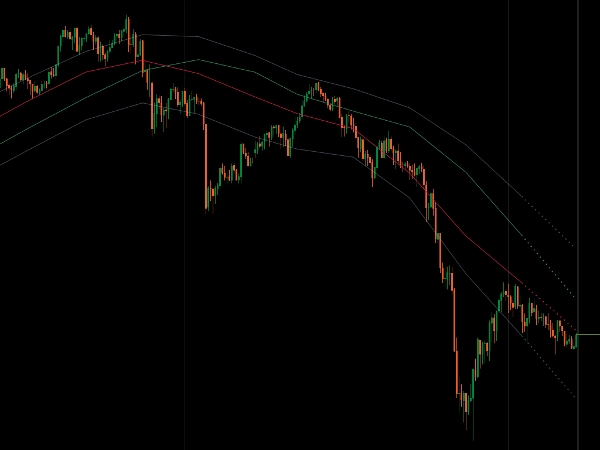
추세선이 있는 다중 시간 프레임
- 낮은 시간 프레임 차트에서 높은 시간 프레임 채널 보기
- 두 가지 표시 모드: 전통적인 계단식 선 또는 대각선 추세선(MTF 전용)
- MTF 바 종가를 연결하여 깔끔한 대각선 구조 생성
- 스마트 예측으로 현재 모멘텀에 기반한 채널 진행 방향 표시
깔끔한 시각 시스템
- 채널 기울기가 모멘텀을 보여줍니다
- 가격 위치가 추세 강도를 보여줍니다
- 경계 반발이 잠재적 반전을 신호합니다
- 완전한 시장 구조 분석을 위한 하나의 지표
__________________________________________________________________________________________
더 많은 무료 지표
구조 및 거래량부터 회귀, 변동성, 맞춤 시간 프레임에 이르기까지 다양한 시장 분석 도구를 탐색하세요.
소스 코드는 GitHub 저장소에서 확인할 수 있습니다.
모두 무료로 사용할 수 있습니다. 하지만 커피 지원을 보내고 싶다면 여기로 보내실 수 있습니다.
지지/저항
거래량
이동 평균
- SSL 채널
- 고정 이동 평균
- 편차 스케일 이동 평균
- 간 고가 저가 활성기
- 순간 추세선
- 트렌드 비전이 포함된 카우프만 적응형 MA
- 이동 평균 채널
- 이동 평균 스위트
- 추세 채널 이동 평균
유틸리티/맞춤형
회귀 기반
변동성
오실레이터
__________________________________________________________________________________________
면책 조항
거래에는 위험이 따릅니다. 이 지표는 기술적 분석용으로만 의도되었으며 항상 적절한 위험 관리와 책임 있는 거래를 적용하세요.
피드백 및 개선 사항
제안, 기능 요청 또는 개선 아이디어가 있으면 토론 탭에 댓글을 남겨주세요. 여러분의 피드백은 모든 사용자를 위한 지표 개선에 도움이 됩니다.
요약
The indicator incorporates built-in Fibonacci reversion zones at 38.2% and 61.8%, which dynamically adjust with price movement to highlight significant pullback areas and provide clear entry and exit reference points. It supports multi-timeframe analysis, allowing higher timeframe channels to be displayed on lower timeframe charts, with two visualization modes: traditional stairstep lines or diagonal trendlines connecting multi-timeframe bar closes. Smart momentum-based projections indicate potential channel direction, while boundary rejection detection signals possible reversals.
This tool offers a cohesive visual system where channel slope reflects momentum and price position indicates trend strength, enabling traders to assess trend direction, momentum shifts, and mean reversion zones across various markets including Forex, Indices, Commodities, Crypto, and Stocks.