Mô tả
Mô tả
Chỉ báo Pinescriptlabs Store: 🤖 Pinescriptlabs Store cBots : (cBot)
Gold & BTC BreakoutSession Pivots(mới)
Hỗ trợ &
Kháng cự SmartTrend
Đường
Phân tích
Cấu trúc Thị trường
Động
của
Các Điểm Quay
Fibonacci
Hồi quy
Tuyến tính
Đa khung thời gian
Khe Giá Trị Công Bằng Động Lực
Theo dõi
Định hướng Nến
Đa cấp độ
Tự động
Hỗ trợ và
Kháng cự
Xu hướng
Đường
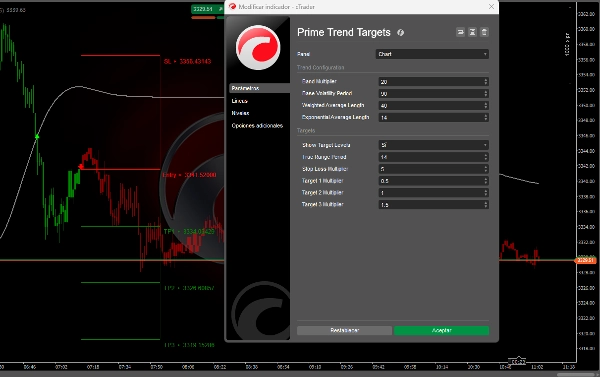
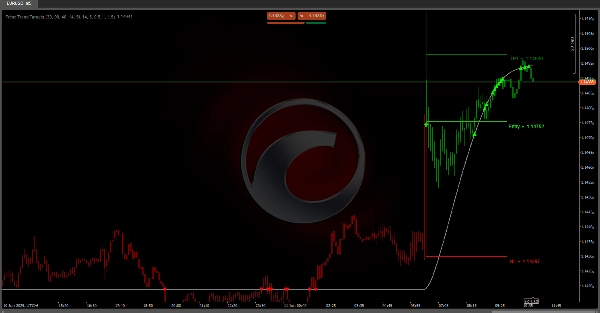
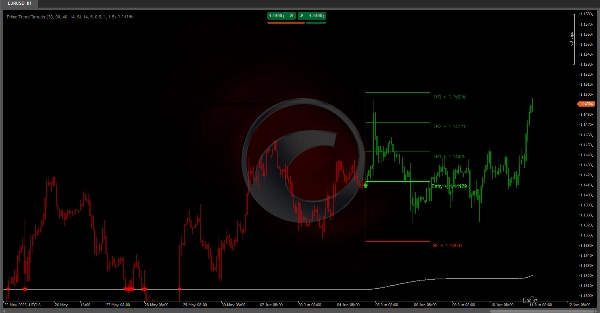
Mục tiêu Xu hướng Chính :
cung cấp một đường xu hướng mượt mà dựa trên dải biến động (ATR) với logic duy trì, lọc bỏ nhiễu nhỏ. 🔄 Nó phát hiện đảo chiều xu hướng bằng cách so sánh giá trị hiện tại của đường với giá trị trước đó và xác nhận tín hiệu thông qua số lần từ chối khi giá liên tục kiểm tra đường. ✅ Khi một sự chuyển pha được xác nhận, nó dự báo điểm vào, điểm dừng lỗ, và lên đến ba mục tiêu điều chỉnh theo biến động (ATR × hệ số), vẽ các mức và vùng rủi ro/lợi nhuận trên biểu đồ. 🎨 Nến được tô màu theo pha để dễ đọc.
⚙️ Ảnh hưởng Tham số
• Độ nhạy cao hơn so với độ bền:
- 📉 Chu kỳ ATR & làm mượt ngắn hơn phản ứng nhanh hơn với đảo chiều nhưng tạo ra nhiều nhiễu hơn.
- 📊 Chu kỳ dài hơn làm mượt tín hiệu giả nhưng có thể làm chậm phát hiện.
- 🔍 Hệ số lớn hơn mở rộng dải và điểm dừng, giảm tín hiệu sai thời gian nhưng tăng độ trễ hoặc thua lỗ nếu đảo chiều dự kiến không xảy ra.
- 🎯 Mục tiêu nhỏ hơn khoá lợi nhuận vừa phải nhanh chóng; mục tiêu lớn hơn nhắm đến các đợt di chuyển kéo dài nhưng với xác suất trúng thấp hơn.
• Điều chỉnh tổng thể: Kết hợp các cài đặt biến động, dải, làm mượt và quản lý mức cho tài sản & khung thời gian của bạn.
✅Hướng dẫn vận hành
• Kiểm tra lại & thử nghiệm demo kỹ lưỡng—thử các kết hợp khác nhau trong các điều kiện đa dạng (xu hướng, dao động, biến động cao/thấp).
• Kết hợp với phân tích khác: Hỗ trợ/kháng cự, mô hình nến, khối lượng hoặc chỉ báo xác nhận.
• Quản lý rủi ro: Xác định kích thước vị thế dựa trên khoảng cách dừng để duy trì tỷ lệ rủi ro cố định.
• Kỷ luật & xem xét định kỳ: Tránh tối ưu hóa quá mức cho dữ liệu quá khứ; điều chỉnh khi điều kiện thị trường thay đổi.
Tóm tắt
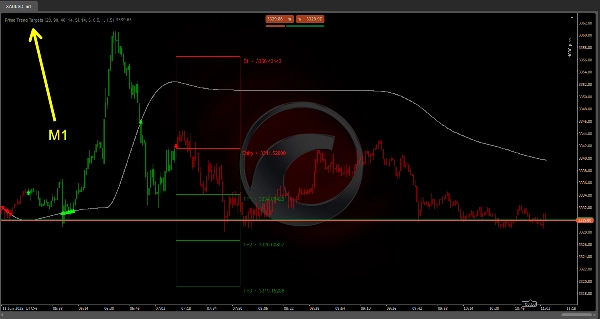
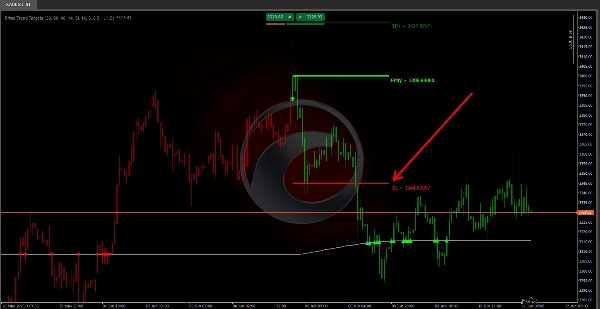
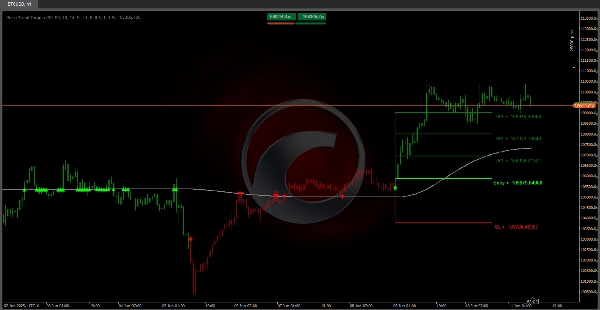
Upon confirming a phase shift, Prime Trend Targets projects key trading levels including entry points, stop loss, and up to three volatility-adjusted targets calculated as ATR multiplied by configurable multipliers. These levels are visually represented on the chart as risk/reward zones. Additionally, the indicator colors candles according to the current market phase for easier interpretation.
Users can adjust parameters to balance sensitivity and robustness: shorter ATR and smoothing periods increase responsiveness but may generate more noise, while longer periods reduce false signals but delay detection. Larger multipliers widen bands and stops, reducing premature signals but potentially increasing lag or losses if reversals fail. Target sizes can be set smaller for quicker gains or larger for extended moves with lower hit probability.
The indicator supports holistic tuning by combining volatility, band, smoothing, and level management settings tailored to specific assets and timeframes. Operational guidelines recommend thorough backtesting, combining with other analysis tools, applying risk management, and maintaining discipline with periodic reviews.
Đánh giá của khách hàng
5 | 0 % | |
4 | 100 % | |
3 | 0 % | |
2 | 0 % | |
1 | 0 % |