

说明
Pinescriptlabs 商店指标: Pinescriptlabs 商店 cBots : (cBot) 黄金 & BTC 突破会话枢轴(新)
价格行为 (新)
智能追踪算法 (新)
描述:
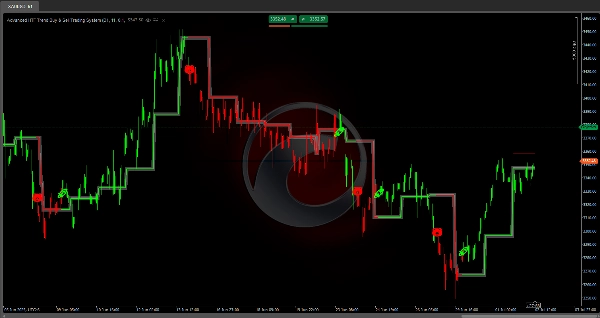
高级 HTF 趋势买卖交易系统
它是什么,有什么用?
它是一个 技术分析算法,自动识别基于历史价格区间的支撑和阻力水平 📈,并检测价格突破这些水平时生成趋势信号 💡。
逻辑如何运作?
1️⃣ 区间计算
指标分析定义的历史周期(完全可配置)以查找:
• 该周期内达到的 最高价 📊
• 该周期内达到的 最低价 📉
• 两个水平之间的 中点 ⚖️
2️⃣ 水平设定
一旦确定极值,指标:
• 在最大水平绘制 红线(阻力)
• 在最小水平绘制 绿线(支撑)
• 为每个水平添加 安全缓冲区以防止错误信号 🛡️
3️⃣ 突破检测
系统持续监控价格以检测:
• 看涨突破 🚀:当价格收盘高于阻力水平 + 缓冲区
• 看跌突破 🐻:当价格收盘低于支撑水平 - 缓冲区
4️⃣ 确认系统
在生成最终信号 ✅ 之前,指标:
• 等待可配置数量的连续柱确认突破 ⏳
• 只有确认后才 正式改变趋势
5️⃣ 动态更新
水平会自动重新计算:
• 当新周期开始(每日、每周或每月,取决于您的设置)🔄
• 线条延伸直到设定新水平
• 中点线 根据当前趋势改变颜色
如何使用?
✨ 信号:
• 买入: 当确认看涨突破时出现 🚀 符号
• 卖出: 当确认看跌突破时出现 🐻 符号
🎨 蜡烛着色:
• 蜡烛根据当前趋势自动着色:
✅ 绿色:活跃的看涨趋势
❌ 红色:活跃的看跌趋势
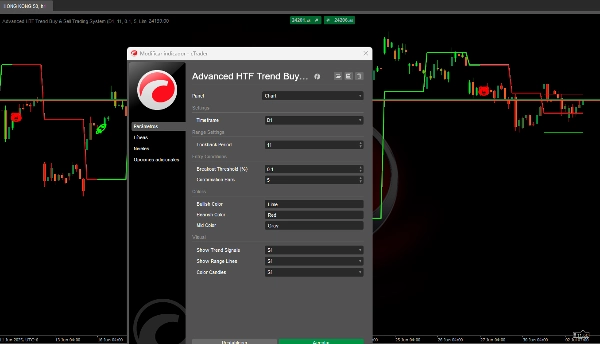
参数设置
🔧 回溯周期 (5–200,默认:11)
控制什么?
用于计算最高价和最低价的历史柱数。
修改时的影响:
• 低值 (5–15):
- 更 灵敏且频繁的水平
- 更多信号数量
- 适合 剥头皮和短期交易
- 理想用于 高波动市场
• 高值 (30–50):
- 更 稳定且持久的水平 🏛️
- 信号较少但更可靠
- 更适合 波段交易和中期持仓
- 理想用于 更稳定的市场
📏 突破阈值 (0.01–5.0%,默认:0.1%)
控制什么?
价格必须超过以确认突破的额外 缓冲区。
修改时的影响:
• 低值 (0.05–0.15%):
- 更早且更敏感的信号 🔍
- 更高的 错误突破风险
- 适合 低点差的外汇主流货币
- 适合 高流动性市场
• 高值 (0.3–1.0%):
- 更晚但 更可靠的信号 🛡️
- 较低的市场噪音风险
- 适合 加密货币和波动性资产
- 适合 点差较大的市场
⏳ 确认柱数 (1–5,默认:1)
控制什么?
在生成信号前,必须有多少连续柱确认突破。
修改时的影响:
• 1 根柱:
- 即时信号 ⚡
- 更多交易机会
- 更高的 过早信号风险
- 适合 活跃交易者
• 2–3 根柱:
- 速度与可靠性之间的 平衡 ⚖️
- 显著减少错误信号
- 适合 大多数策略
• 4–5 根柱:
- 非常 保守的信号 🕊️
- 最大可靠性
- 可能 错过早期机会
- 适合 长期持仓
📊 按资产类型优化
💱 外汇主流货币(EUR/USD、GBP/USD 等)
• 回溯:15–25
• 阈值:0.05–0.15%
• 确认:1–2 根柱
💰 加密货币
• 回溯:10–20
• 阈值:0.2–0.8%
• 确认:2–3 根柱
📈 股票指数
• 回溯:20–30
• 阈值:0.1–0.3%
• 确认:1–2 根柱
🌾 商品
• 回溯:25–35
• 阈值:0.15–0.4%
• 确认:2–3 根柱
注意事项
• 在非常快速移动的市场中可能产生 延迟信号 🏃♂️
• 在极度横盘市场中效果较差
• 需要根据 资产和时间框架 调整参数 ⏱️
摘要
The system continuously monitors price action to detect bullish breakouts (price closing above resistance plus buffer) and bearish breakouts (price closing below support minus buffer). It includes a confirmation mechanism that waits for a configurable number of consecutive bars confirming the breakout before officially signaling a trend change. The midpoint line changes color to reflect the current trend, and all levels update dynamically at the start of new periods (daily, weekly, or monthly).
Signals are visually indicated with symbols: a rocket (🚀) for confirmed bullish breakouts and a bear (🐻) for confirmed bearish breakouts. Candles are colored green for active bullish trends and red for bearish trends.
Key adjustable parameters include lookback period (5–200 bars), breakout threshold buffer (0.01–5.0%), and confirmation bars (1–5). These settings can be optimized for various asset types such as Forex majors, cryptocurrencies, stock indices, and commodities, balancing signal frequency, reliability, and market conditions. The indicator supports multiple timeframes and is suitable for scalping, swing trading, and longer-term strategies depending on configuration.


!["[Stellar Strategies] Smart ADX" 标识](https://cdn.ctrader.com/image/webp/af13b084-b6f6-41db-b7bc-c7e688b57b05_36929)

