
الوصف
مؤشرات متجر Pinescriptlabs: 🤖متجر Pinescriptlabs cBots : (cBot)
PRICE ACTION (جديد)
اختراق الذهب و BTCنقاط محورية للجلسة(جديد)
خوارزمية ذكية متتبعة(جديد)
دعم SmartTrend و
المقاومة
خطوط
تحليل
هيكل السوق الديناميكي
لـ
نقاط التحول
فيبوناتشي
انحدار خطي
متعدد الأطر الزمنية
متعدد الأطر الزمنية
متعدد المستويات
انحياز الشمعة
المتعقب
دعم تلقائي و
مقاومة
اتجاه
خطوط
جميع
مستويات الدعم و
المقاومة
المستويات
دعم ومقاومة زيغ زاج مع التقلبات
1. ماذا يفعل هذا المؤشر؟ ❓
🔍 يكشف تقلبات السعر (الارتفاعات والانخفاضات)
- يفحص الأشرطة الأخيرة ("عمق التحليل") للعثور على أعلى/أدنى سعر في تلك الفترة.
- يؤكد التقلبات باستخدام نسبة مئوية كعتبة (مثلاً، تغير 1%+ مقارنة بالتقلب السابق) → يحدد ✅ الارتفاعات/الانخفاضات الجديدة.
- يقلل الضوضاء ⚡: يؤكد التقلبات فقط إذا مر نصف فترة التحليل دون وجود ارتفاع أعلى/انخفاض أدنى.
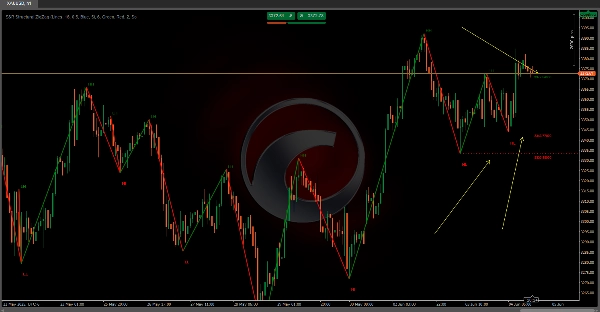
📉 يرسم خطوط اتجاه زيغ زاج
- يربط التقلبات بخطوط ديناميكية:
-
- 🟢 أخضر = اتجاه صاعد (تقلب جديد > السابق).
- 🔴 أحمر = اتجاه هابط (تقلب جديد < السابق).
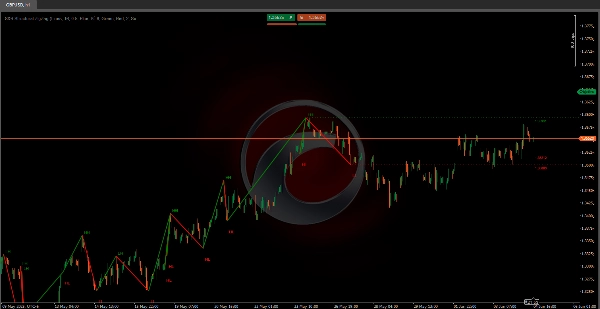
⏹️ يسلط الضوء على المستويات الرئيسية
- خطوط الدعم/المقاومة: مرسومة عند سعر كل تقلب، ممتدة نحو اليمين
- تُظهر التسميات قيم الأسعار 📌 (مثلاً، "1.1050") لتحليل فوري.
🚦 يكشف هيكل السوق
- يحدد الاتجاهات بنظرة سريعة:
-
- صاعد = ارتفاعات أعلى (HH) + انخفاضات أعلى (HL).
- هابط = انخفاضات أعلى (LH) + انخفاضات أدنى (LL).
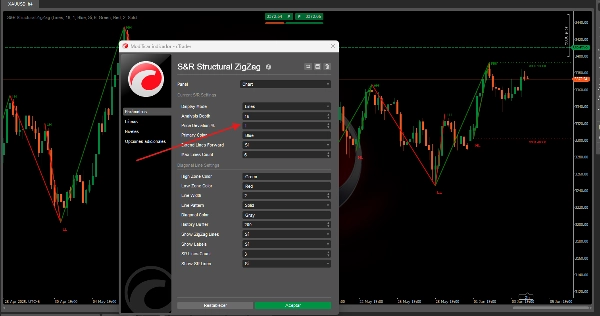
2. كيفية استخدامه (دليل الإعداد) ⚙️
التثبيت على cTrader: اسحب وأفلت على الرسم البياني الخاص بك!
الإعدادات الرئيسية:
- عمق التحليل 🔎:
10(افتراضي) → القيم الأعلى تصفي الضوضاء؛ القيم الأدنى تلتقط المزيد من التقلبات. - نسبة انحراف السعر % 📏:
1.0%(قابلة للتعديل) → الحد الأدنى لتغير السعر لتأكيد التقلبات. - تسميات التقلبات 🏷️ (HH/HL/LH/LL): تشغيل/إيقاف.
- تمديد الخطوط ➡️: إسقاط مستويات الدعم/المقاومة إلى ما لا نهاية أو تحديدها على الأشرطة الحالية.
الملخص
تقييمات العملاء
5 | 100 % | |
4 | 0 % | |
3 | 0 % | |
2 | 0 % | |
1 | 0 % |


![شعار "Smart Money Concepts (SMC) [Iridio Capital]"](https://cdn.ctrader.com/image/webp/28b69fd1-ef54-4bed-9487-07e78e883be4_40934)


![شعار "[Hamster-Coder] Pivot Points MTF"](https://cdn.ctrader.com/image/webp/4c143e5a-309c-40e3-a578-f04d1e133ffa_31159)