Description
Pinescriptlabs Store indicators: 🤖 Pinescriptlabs Store cBots : (cBot)
Gold & BTC BreakoutSession Pivots(new)
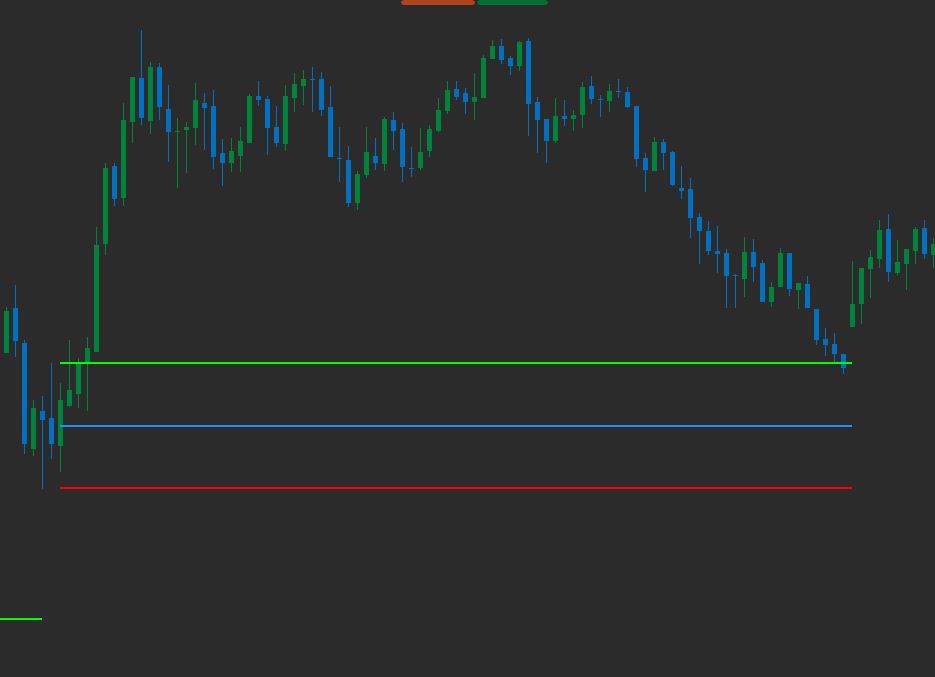
SmartTrend Support &
Resistance
Lines
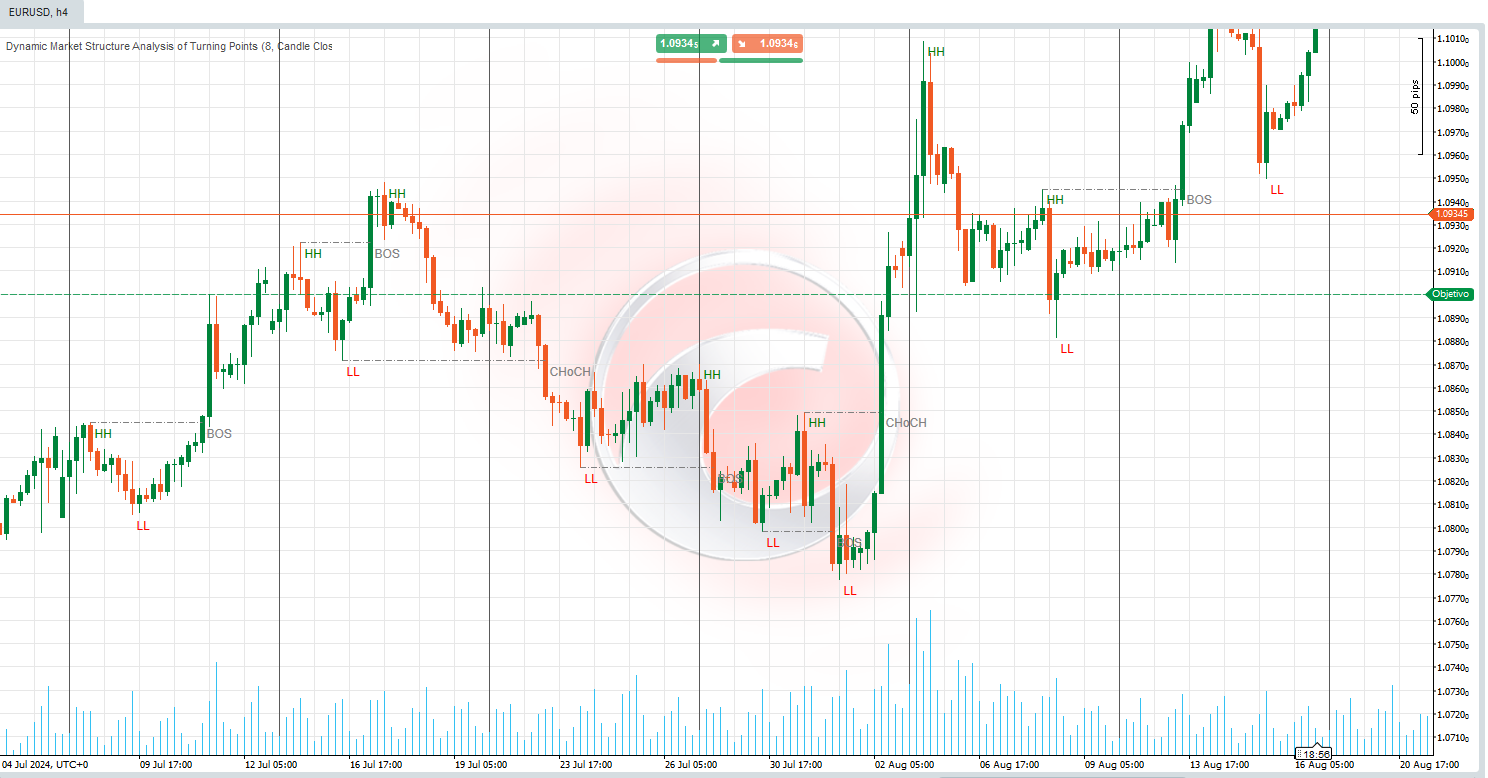
Dynamic
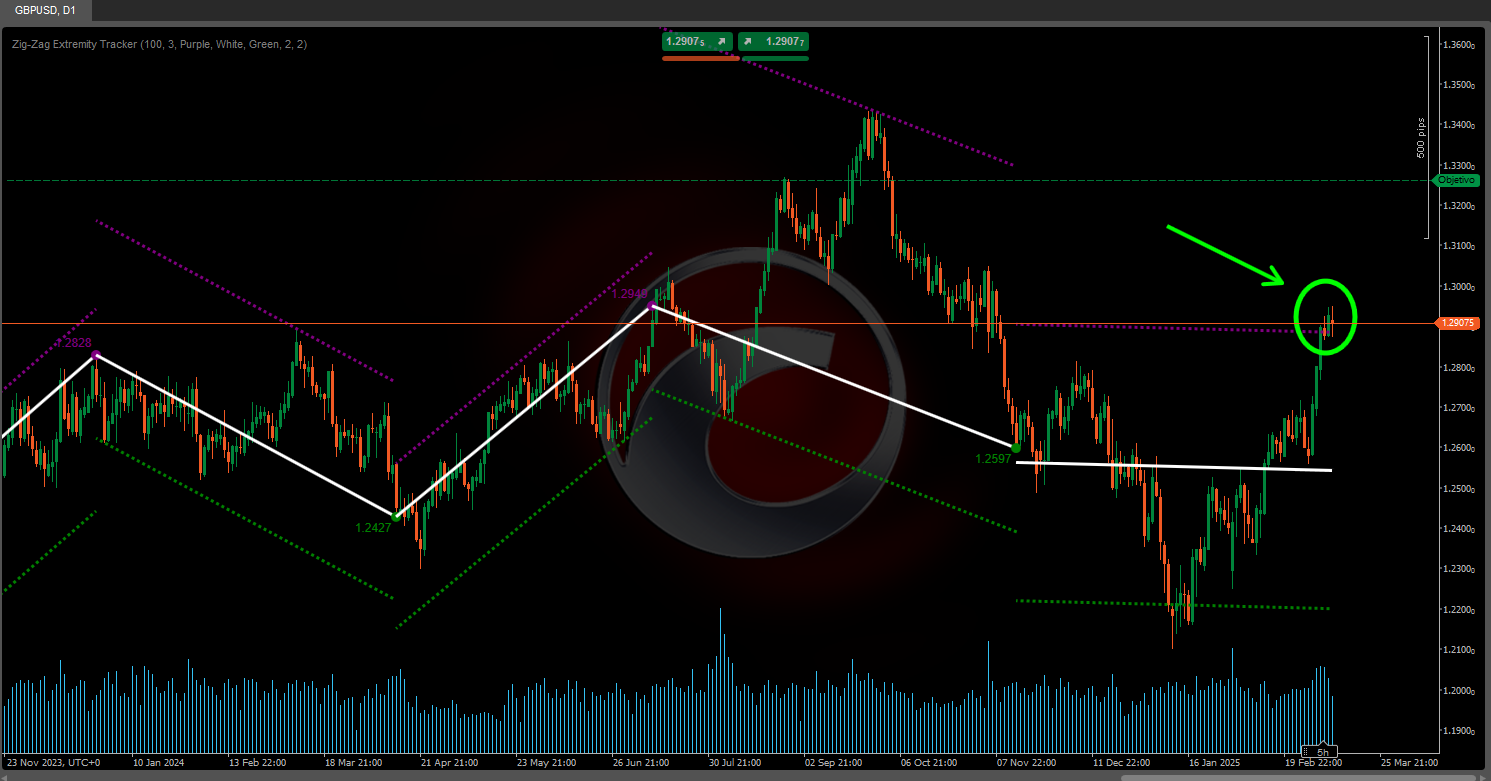
Market Structure
Analysis
of
Turning Points
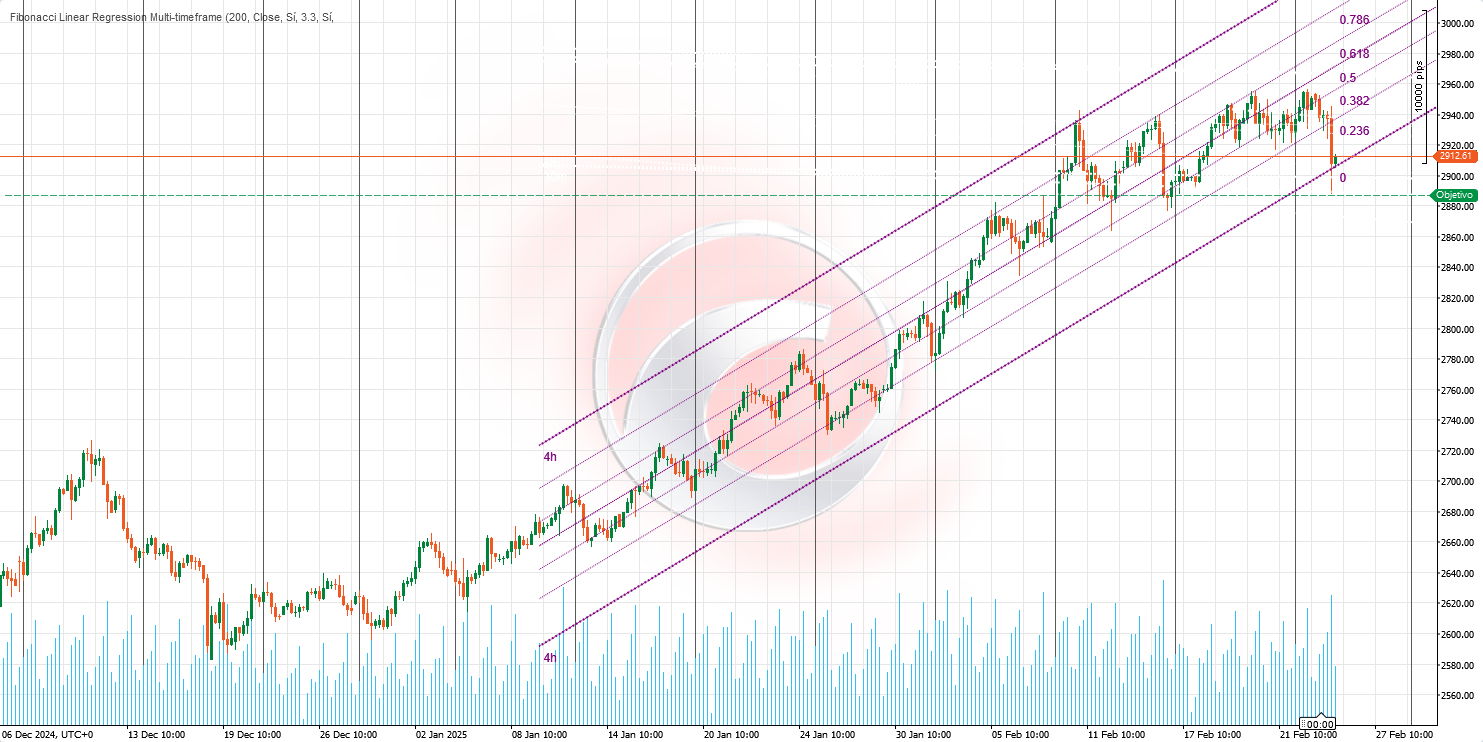
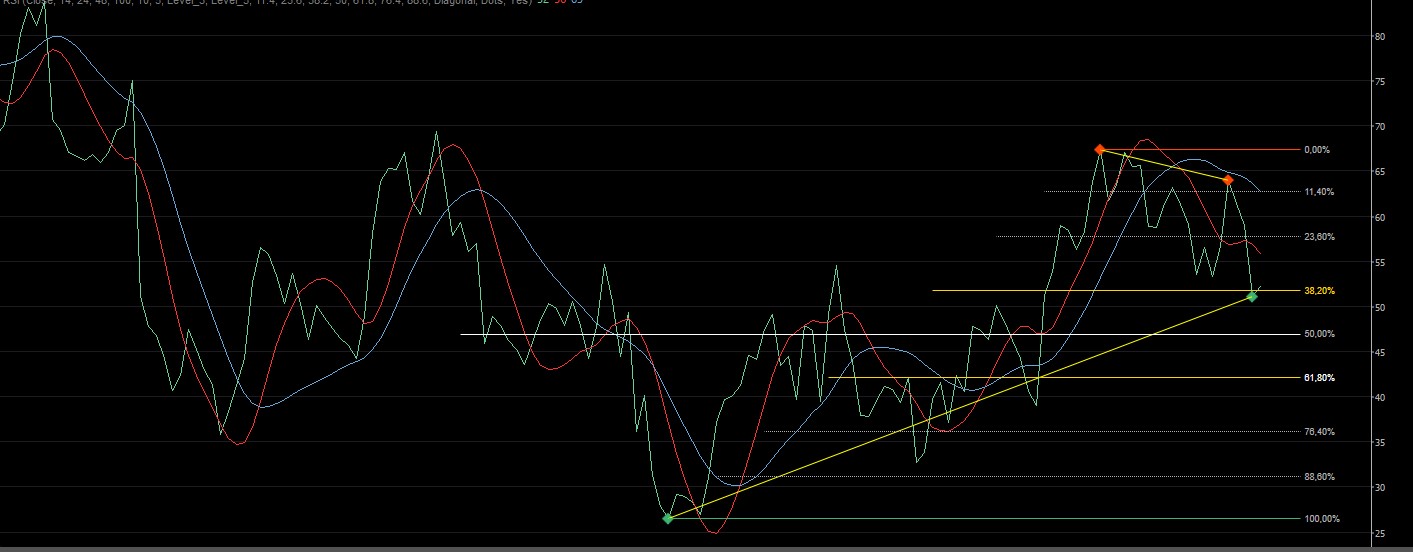
Fibonacci
Linear
Regression
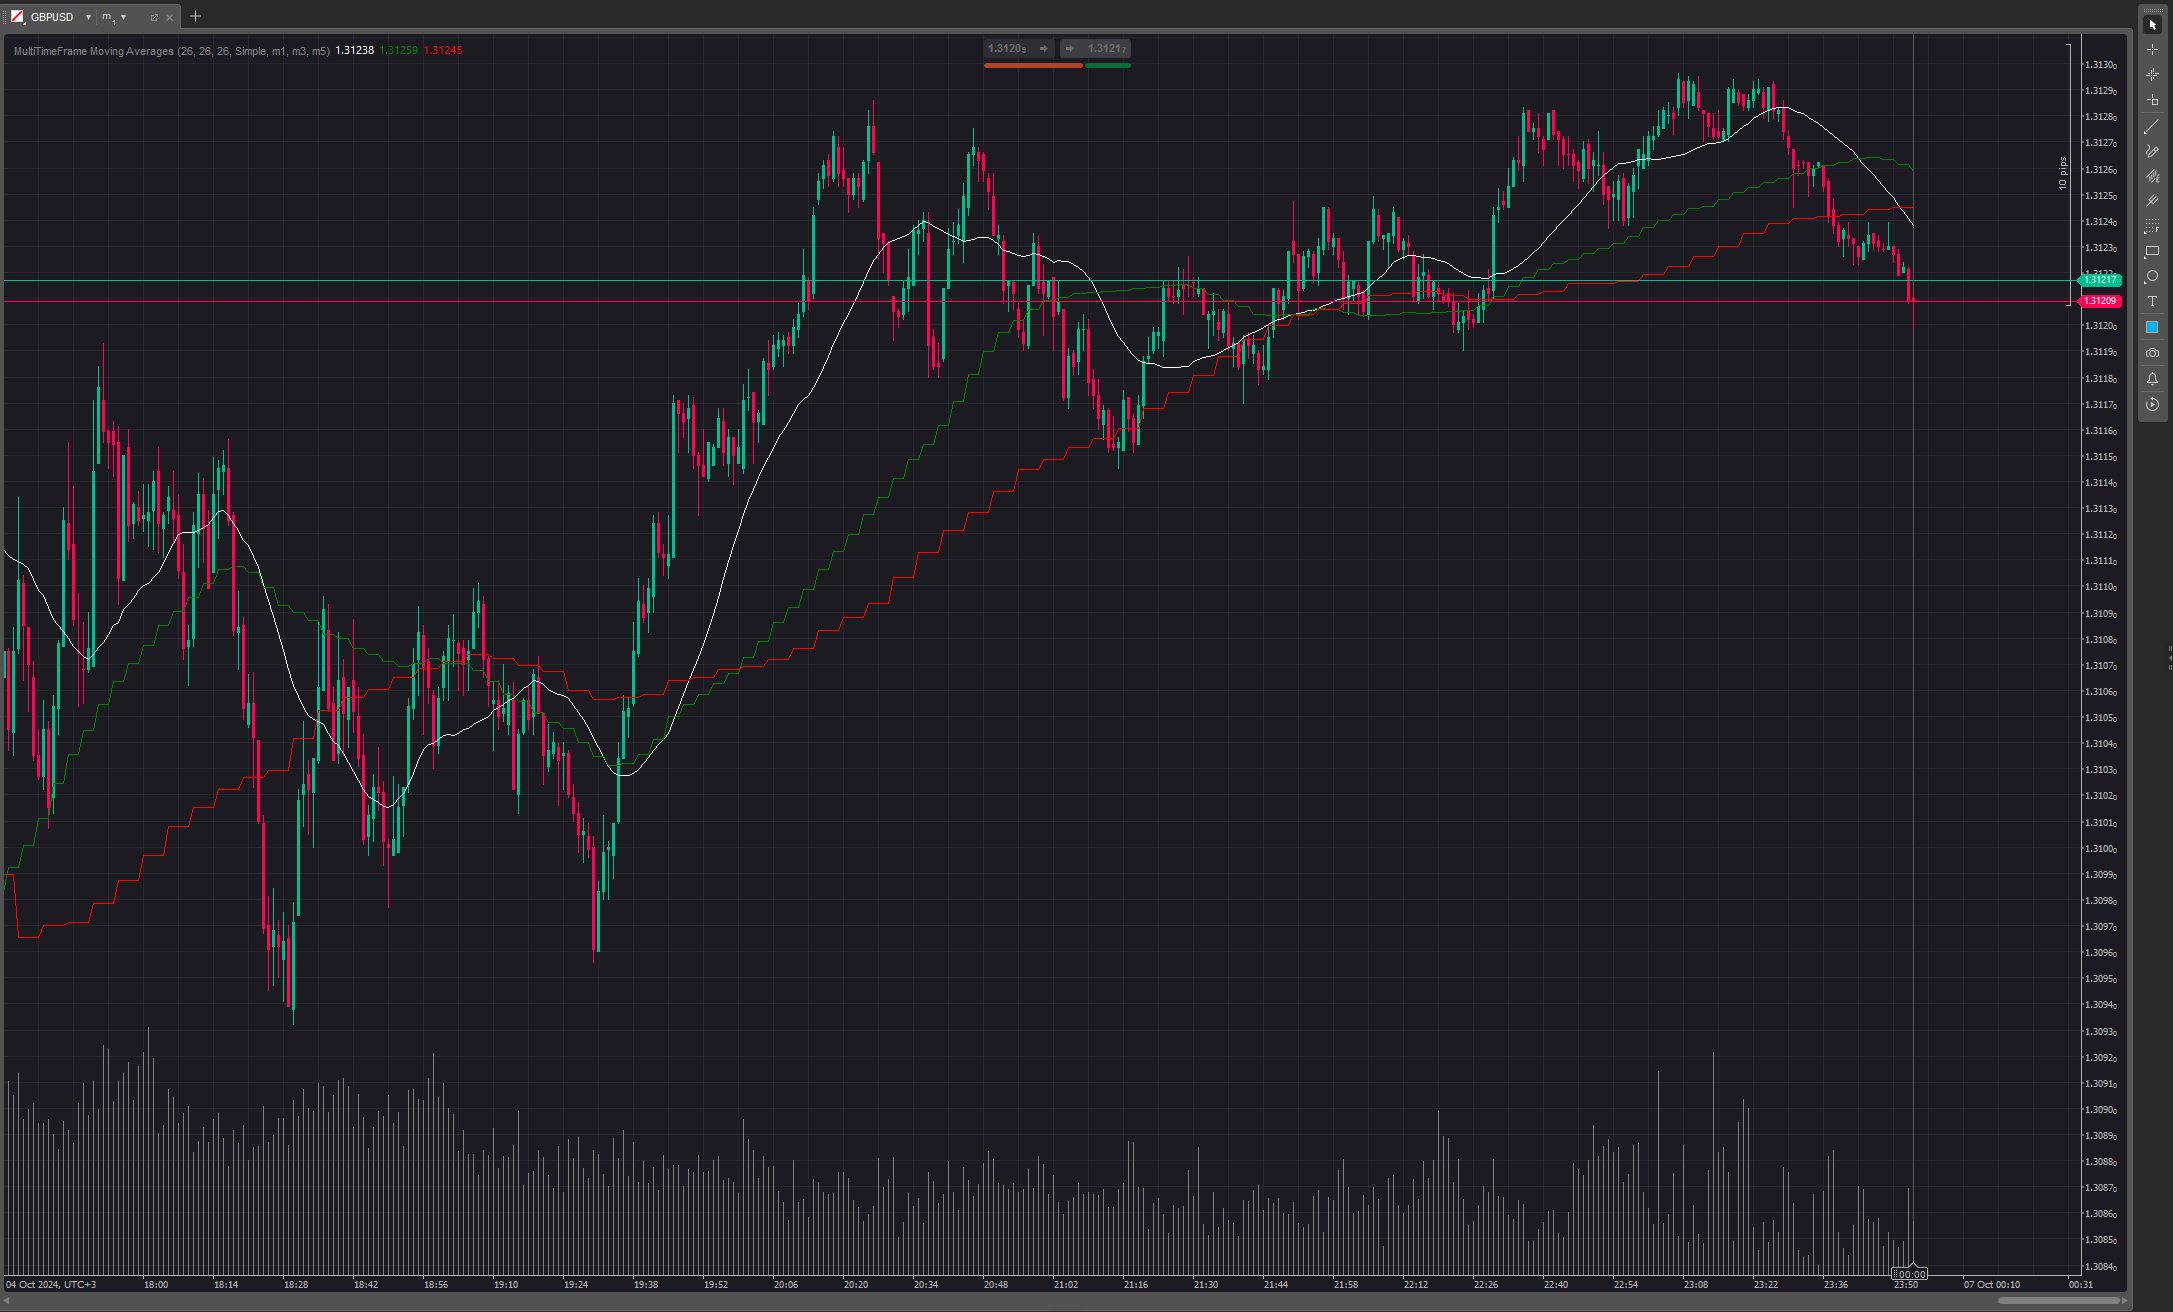
Multi-timeframe
Auto
Support and
Resistance
Trend
Lines
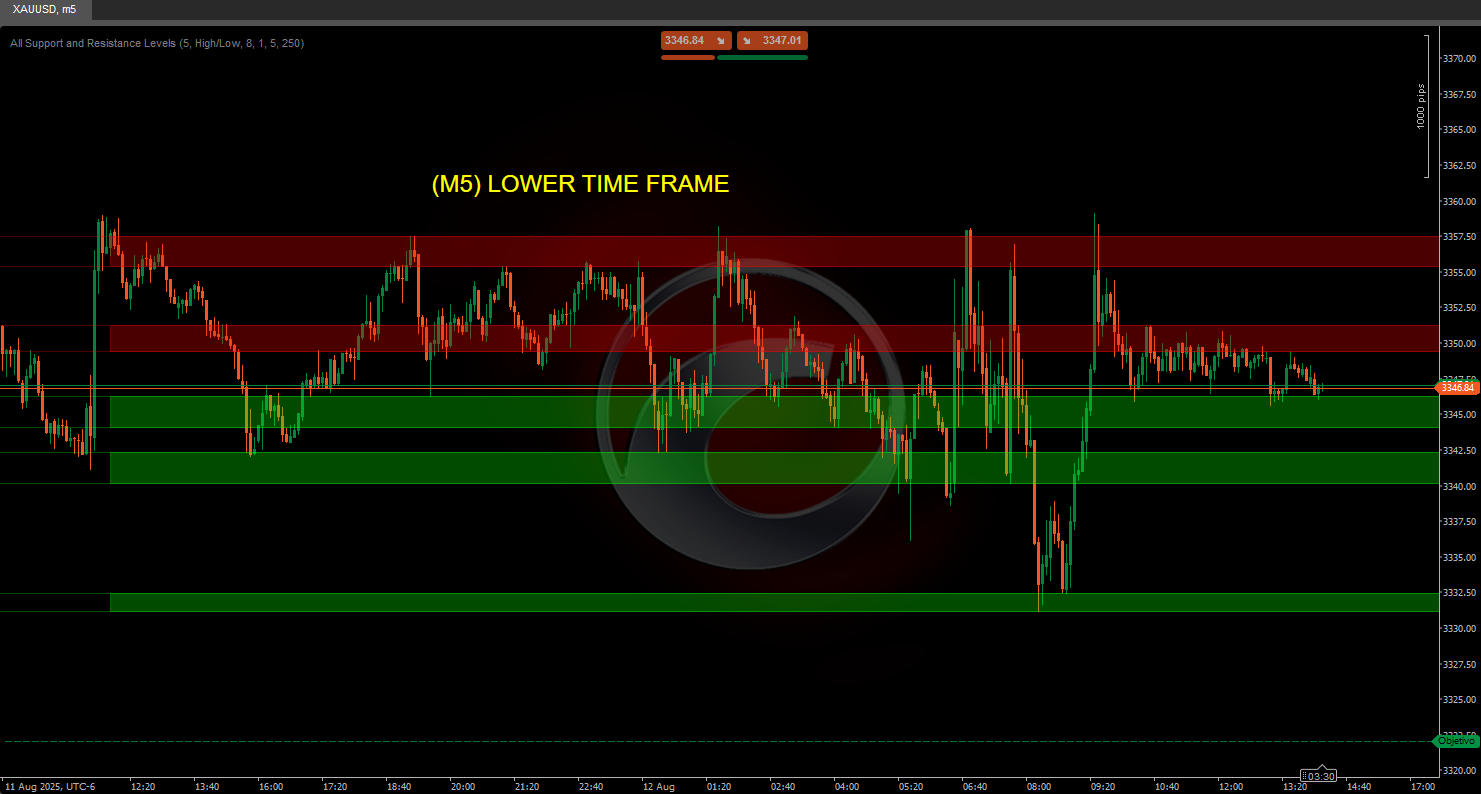
All
Support and
Resistance
Levels
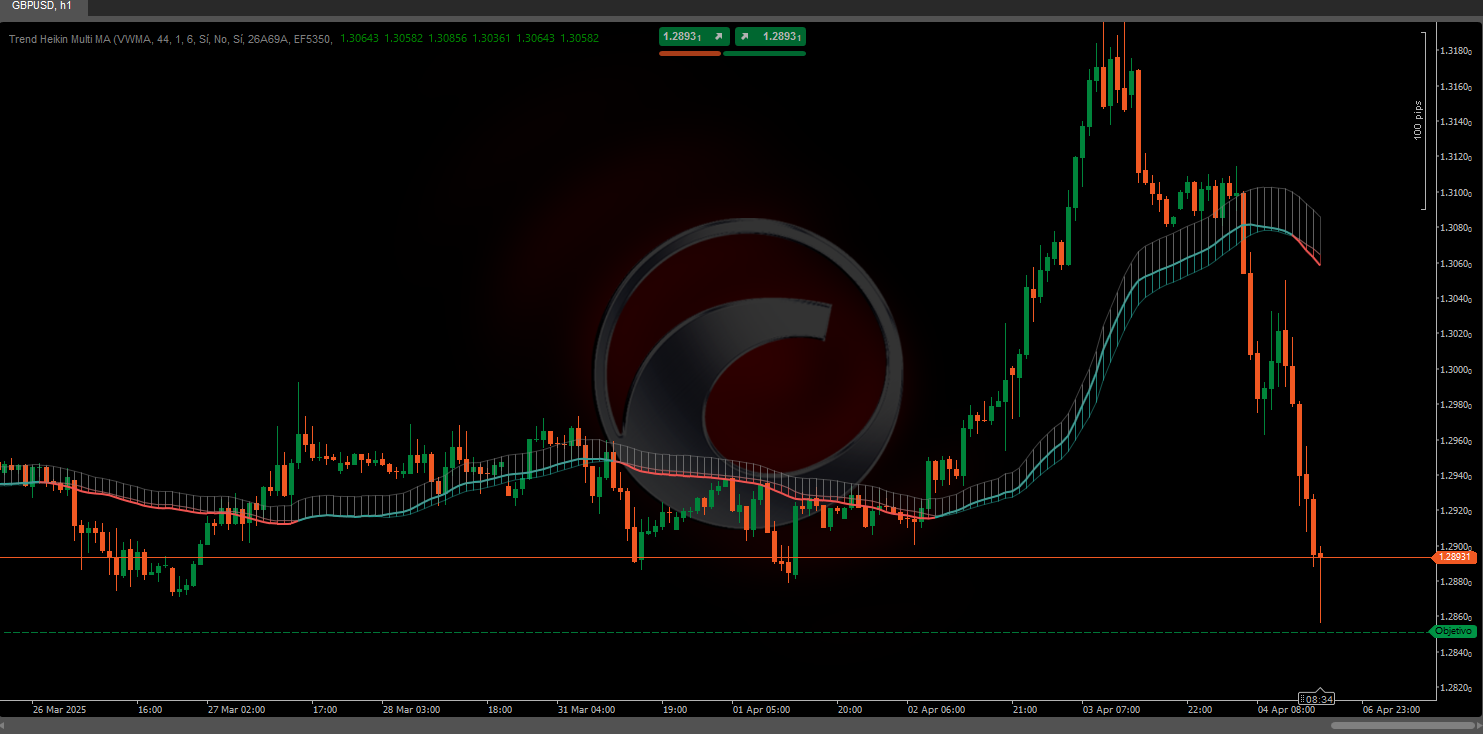
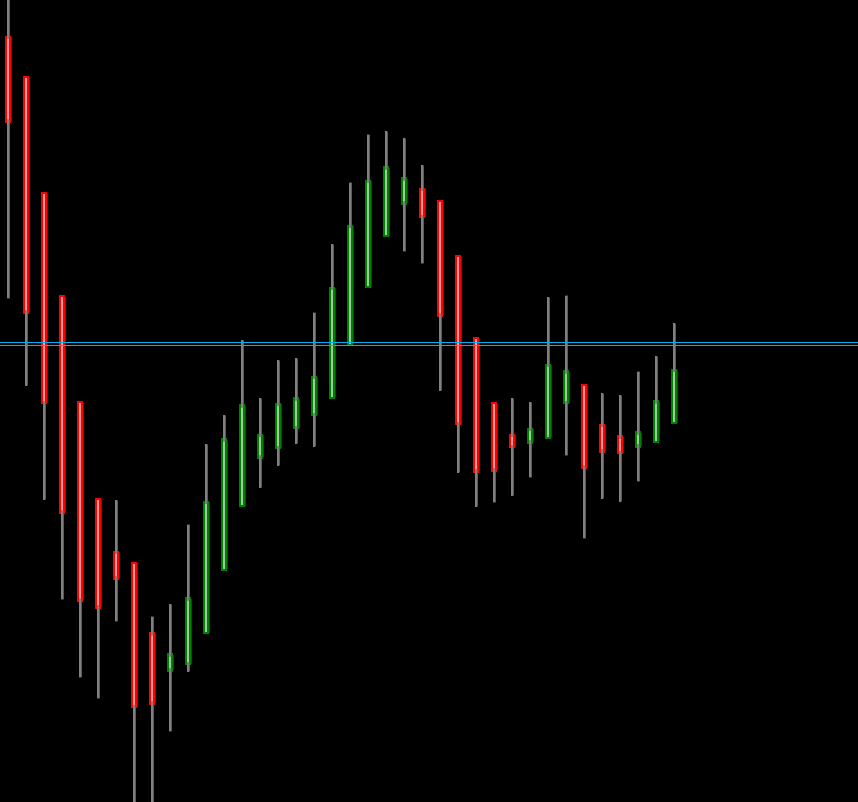
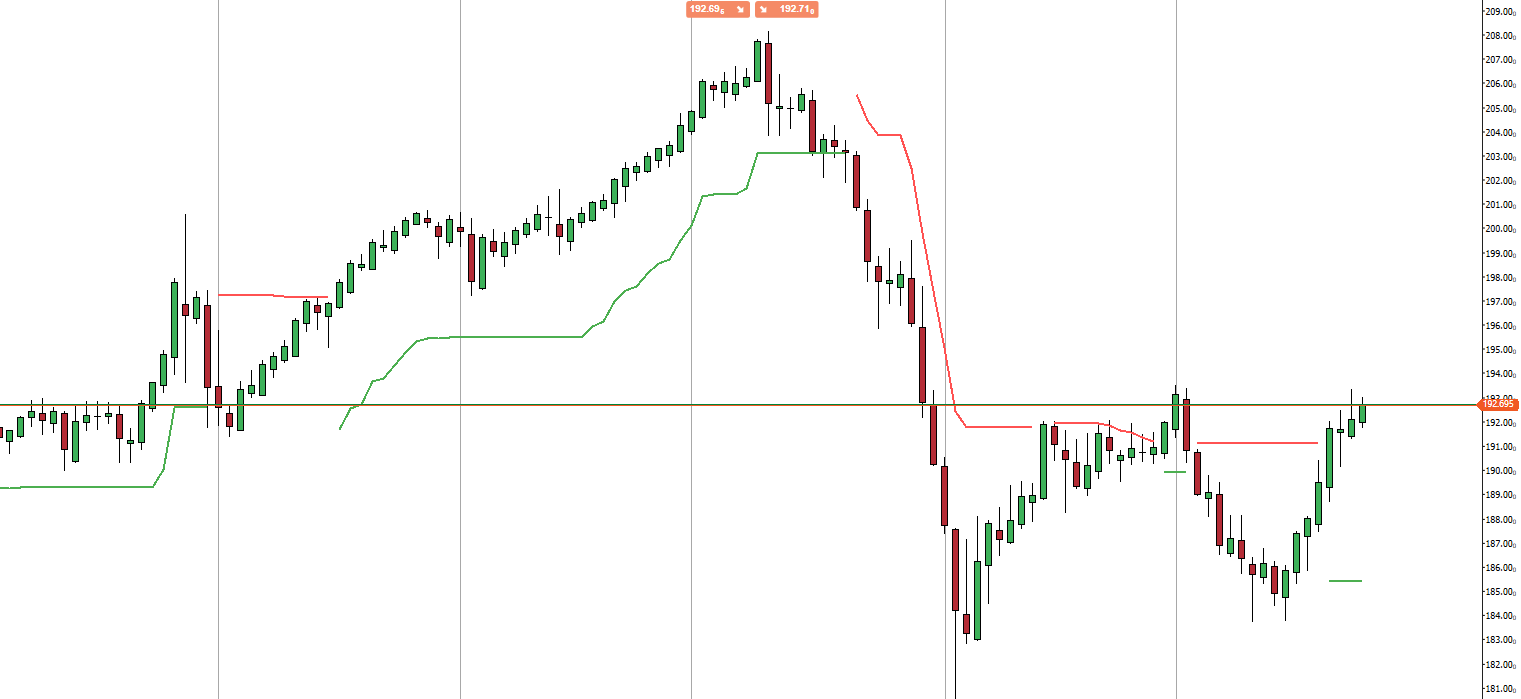
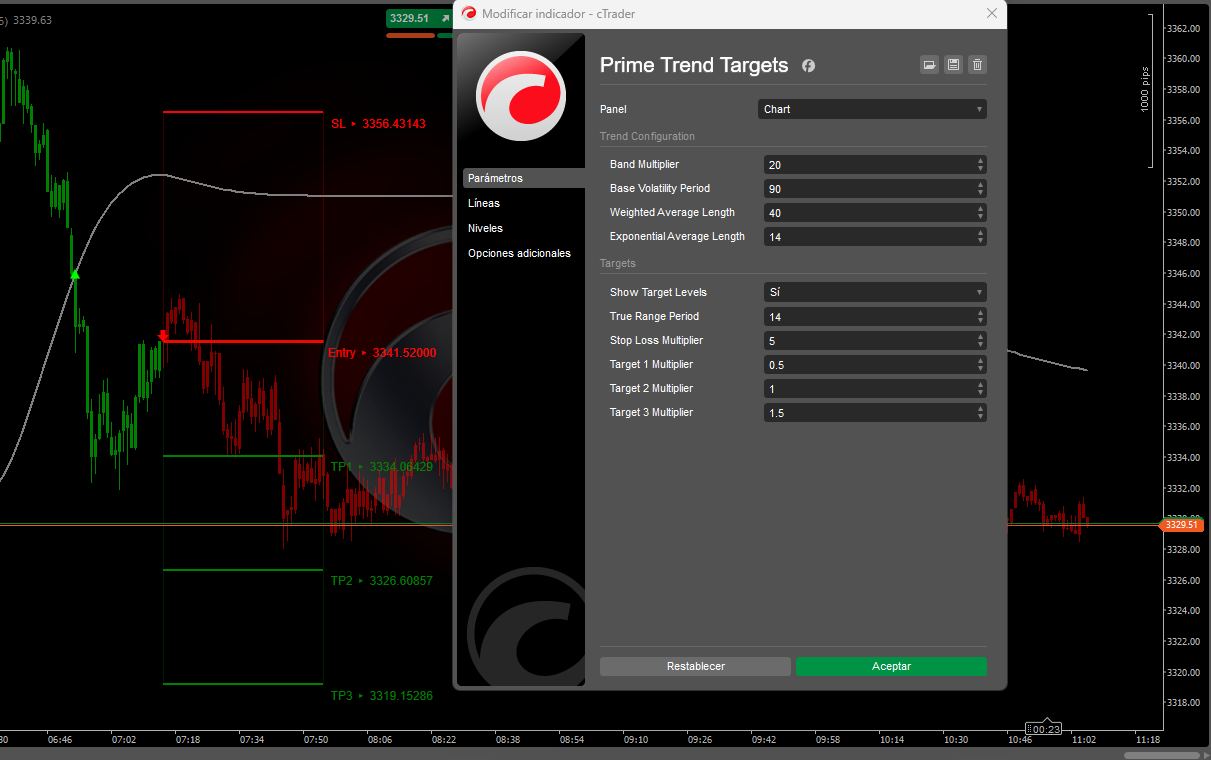
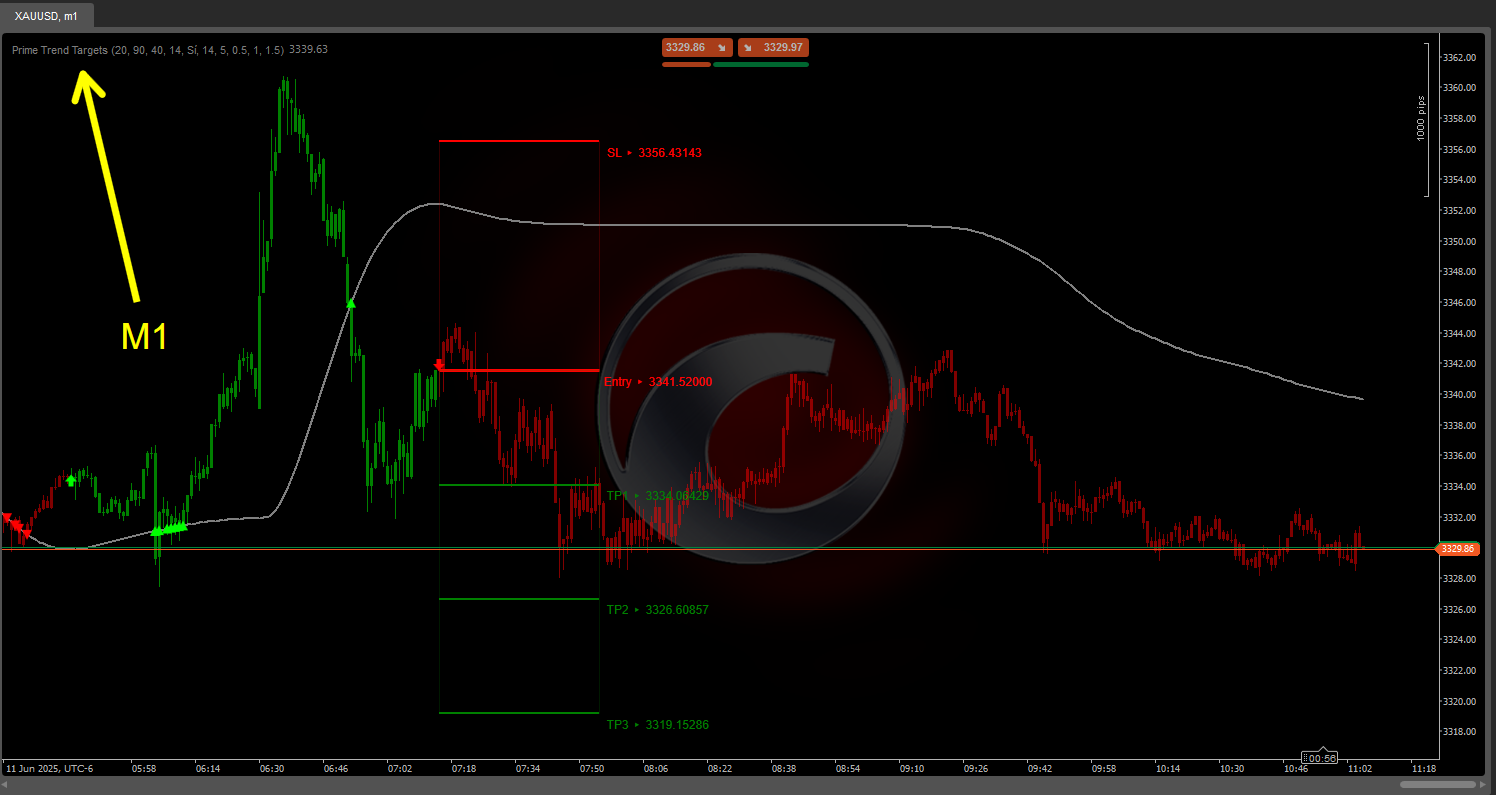
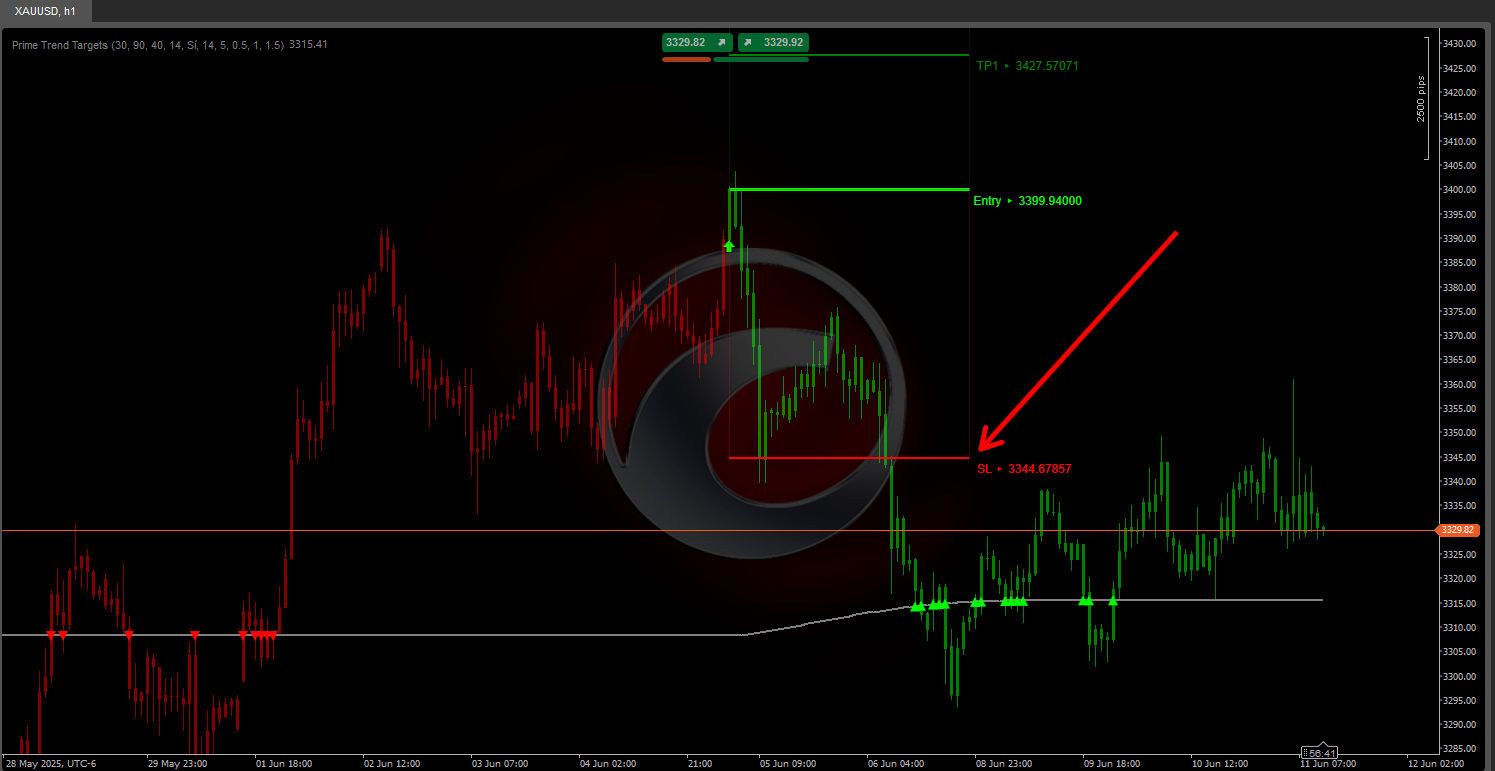
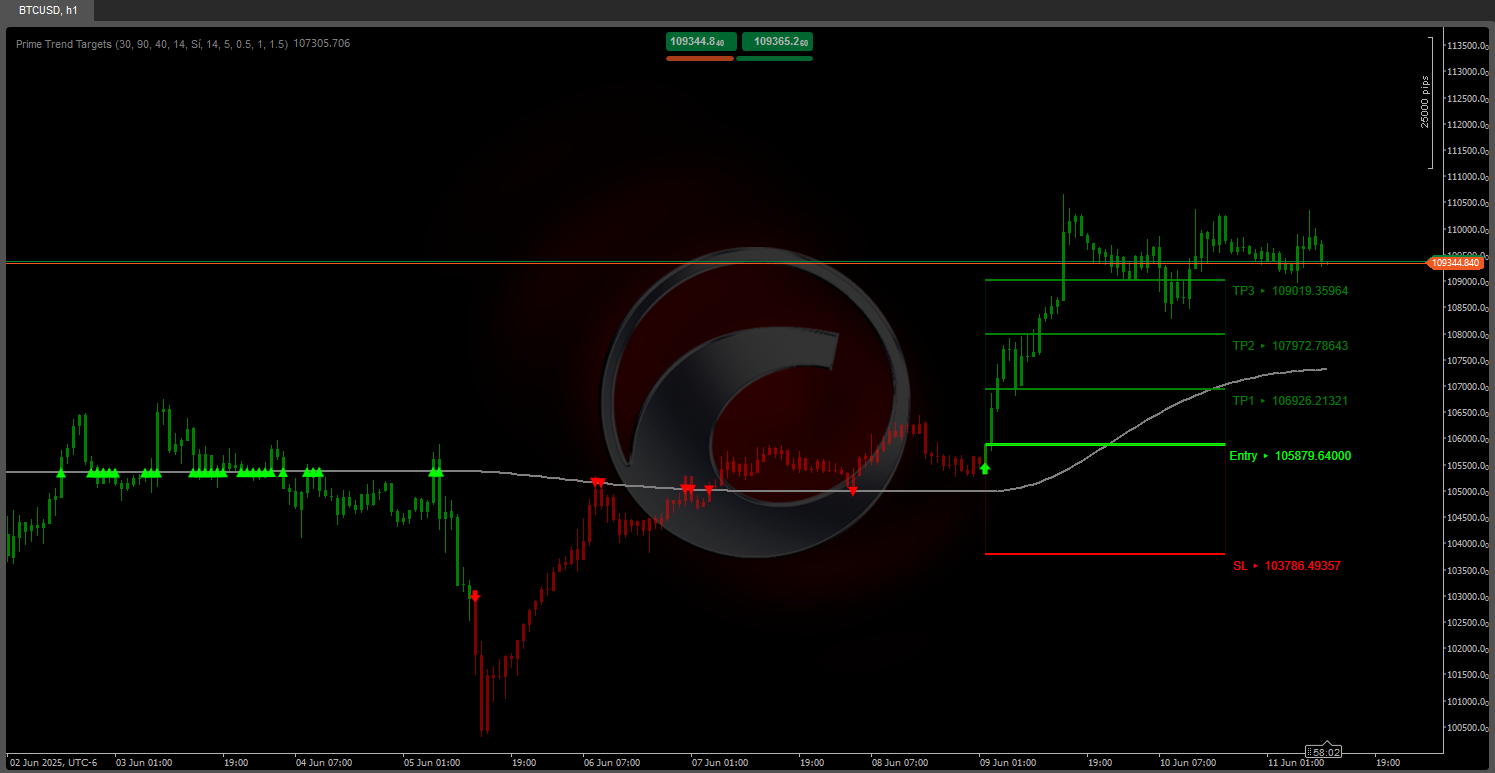
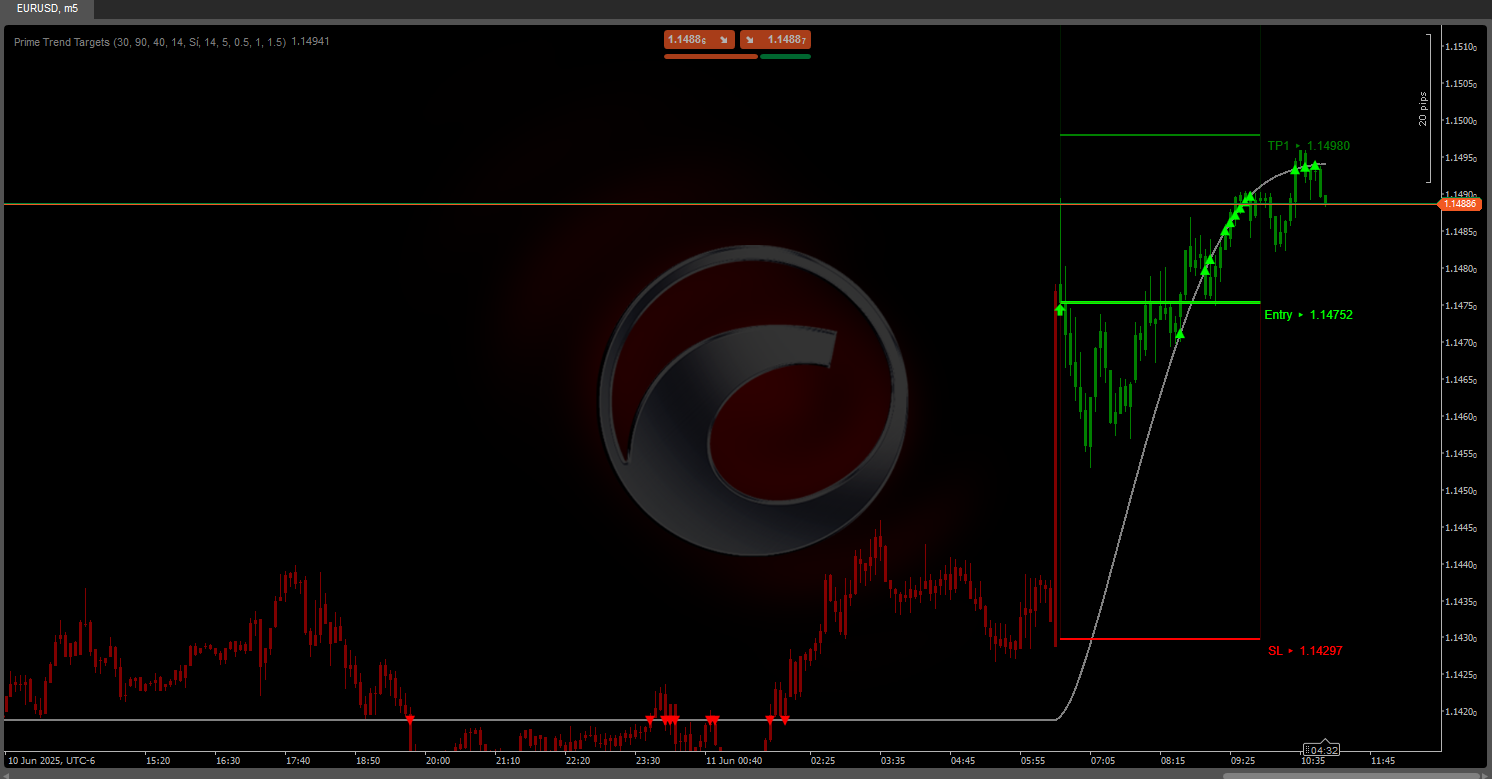
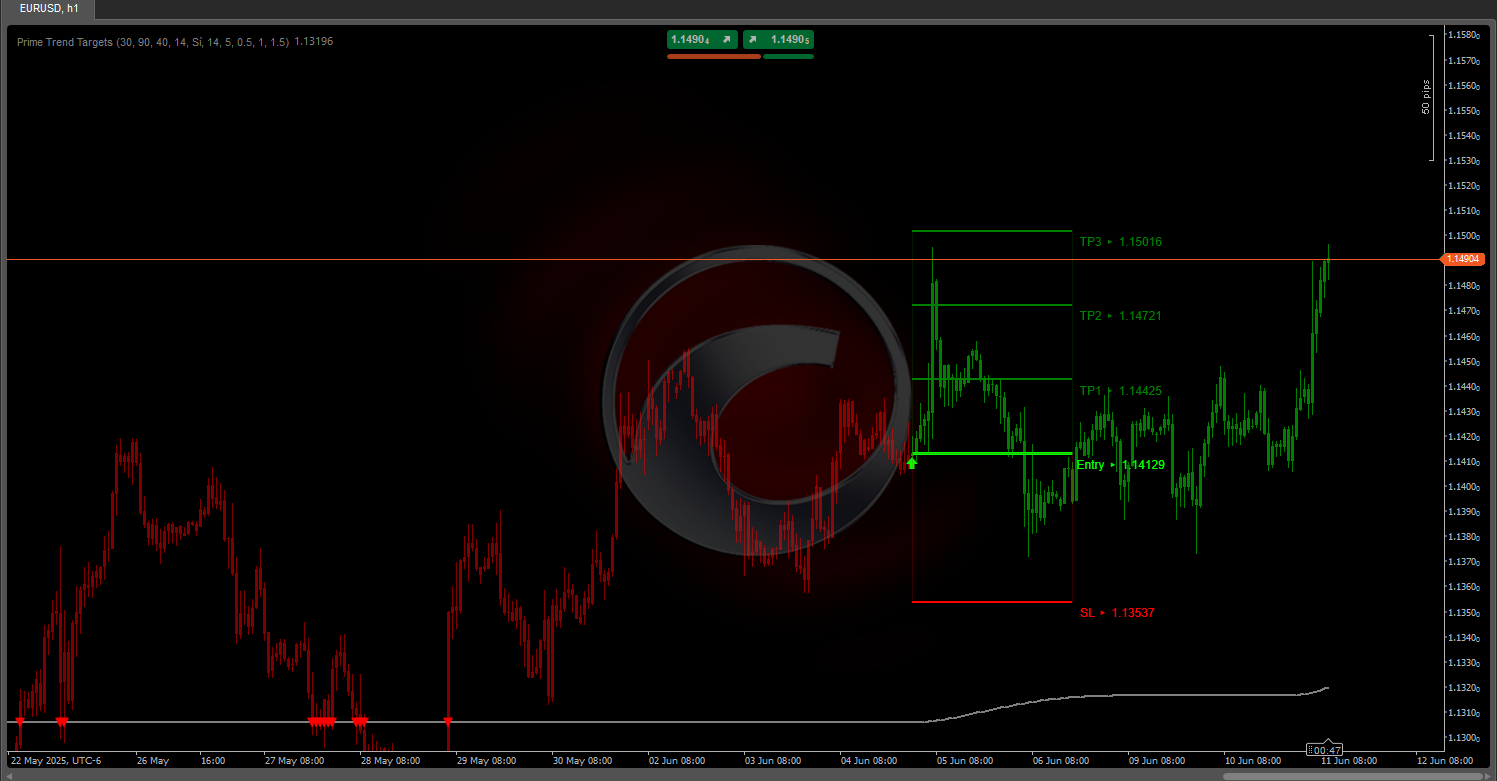
Prime Trend Targets :
offers a smoothed trendline based on volatility bands (ATR) with persistence logic, filtering out minor noise. 🔄 It detects trend reversals by comparing the current value of the line with the previous one and validates signals through a rejection count when price repeatedly tests the line. ✅ Once a phase shift is confirmed, it projects entry, stop loss, and up to three volatility-adjusted targets (ATR × multipliers), drawing risk/reward levels and zones on the chart. 🎨 Candles are colored by phase for easy reading.
⚙️ Parameter Impact
• Higher sensitivity vs. robustness:
- 📉 Shorter ATR & smoothing periods react faster to reversals but generate more noise.
- 📊 Longer periods smooth out false signals but may delay detection.
- 🔍 Larger multipliers widen bands & stops, reducing premature signals but increasing lag or losses if the expected reversal fails.
- 🎯 Smaller targets lock in moderate gains quickly; larger targets aim for extended moves but with lower hit probability.
• Holistic tuning: Combine volatility, band, smoothing, and level management settings for your asset & timeframe.
✅Operational Guidelines
• Backtest & demo-test thoroughly—try different combos under varied conditions (trending, ranging, high/low volatility).
• Combine with other analysis: Support/resistance, candlestick patterns, volume, or confirming indicators.
• Risk management: Size positions based on stop distance to maintain a fixed risk percentage.
• Discipline & periodic review: Avoid over-optimizing for past data; adjust when market conditions shift.