🌟 Fibonacci Linear Regression🌟
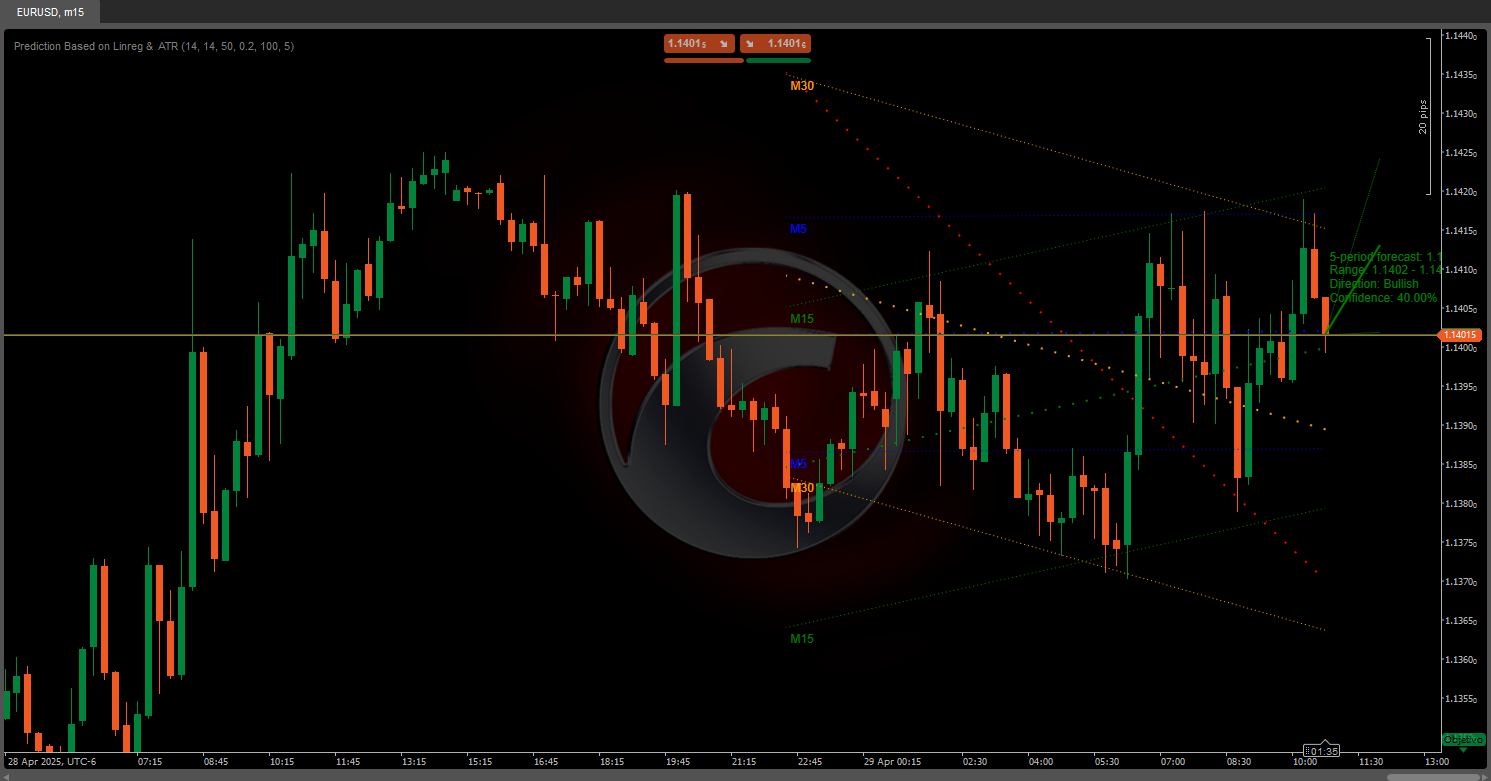
The Fibonacci Regression Bands indicator is an advanced technical tool that combines the power of regression lines with Fibonacci levels to identify trends, support/resistance zones, and potential reversal points in financial markets. 📈 This indicator offers a multidimensional perspective by analyzing multiple timeframes simultaneously (5m, 15m, 30m, and 4h), allowing traders to pinpoint areas of confluence with greater precision. ⏳
🎯 What Does the Indicator Do?
The indicator creates regression channels based on historical price data and integrates them with Fibonacci retracement levels, providing a comprehensive visual map of key market zones. By analyzing various timeframes, it offers a holistic view of price behavior, blending long-term trends with short-term price action. 📊
🔍 Main Components
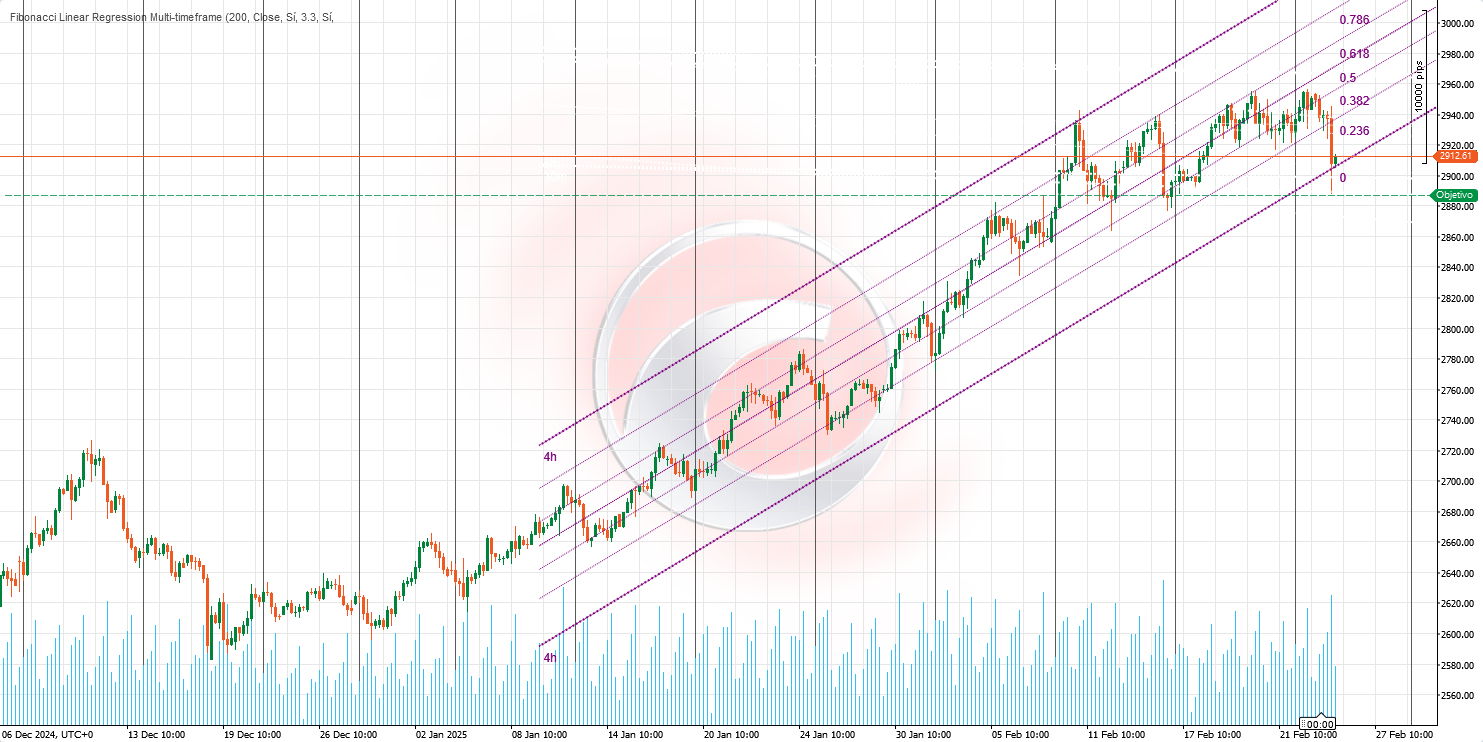
- Regression Channels: The indicator calculates linear regression lines over a user-defined period (default: 200 bars) to show the overall price trend. 📉📈
- Deviation Bands: Upper and lower bands are drawn around the central regression line, representing statistical deviations from the price, similar to Bollinger Bands but based on linear regression. 📐
- Fibonacci Levels: Classic Fibonacci levels (0, 0.236, 0.382, 0.5, 0.618, 0.786, and 1) are plotted within the channel, offering potential bounce or continuation points. 🔢
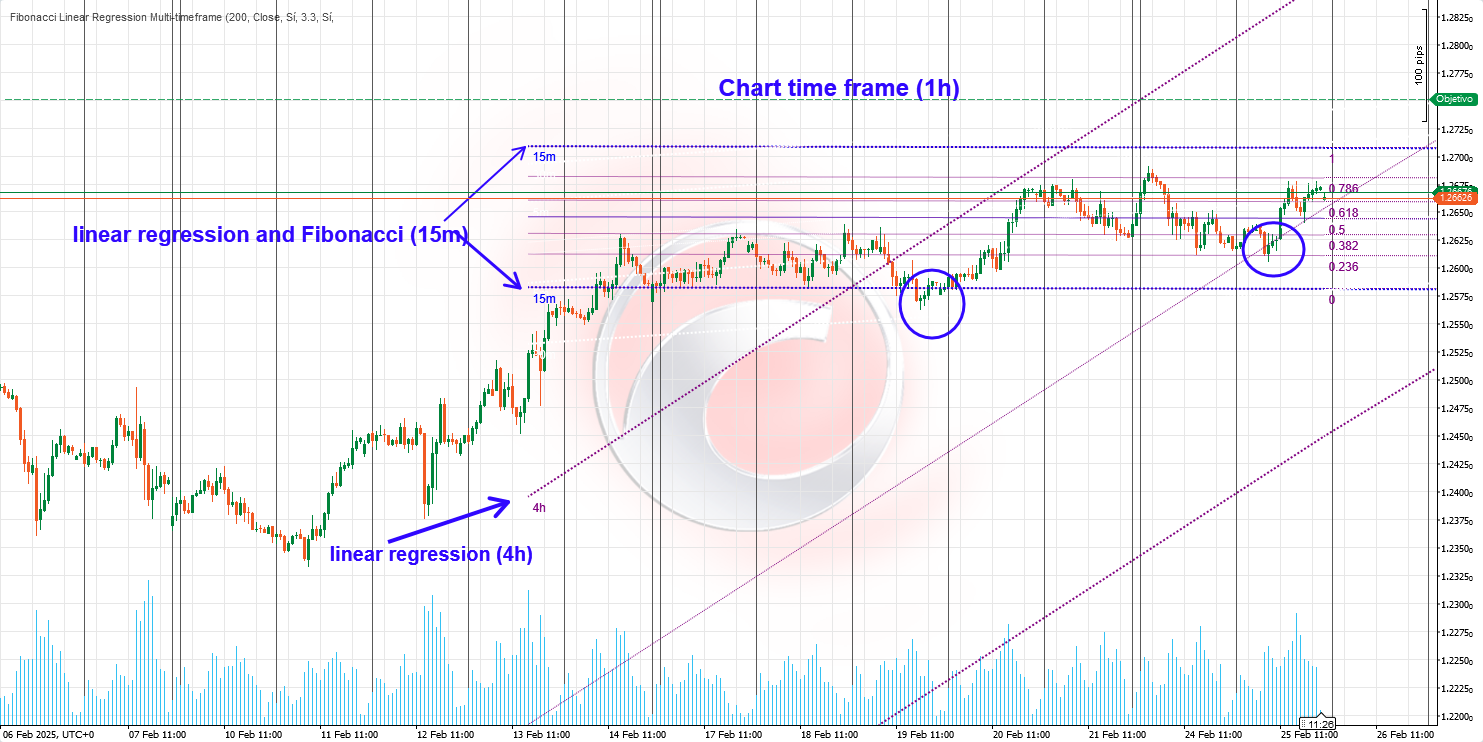
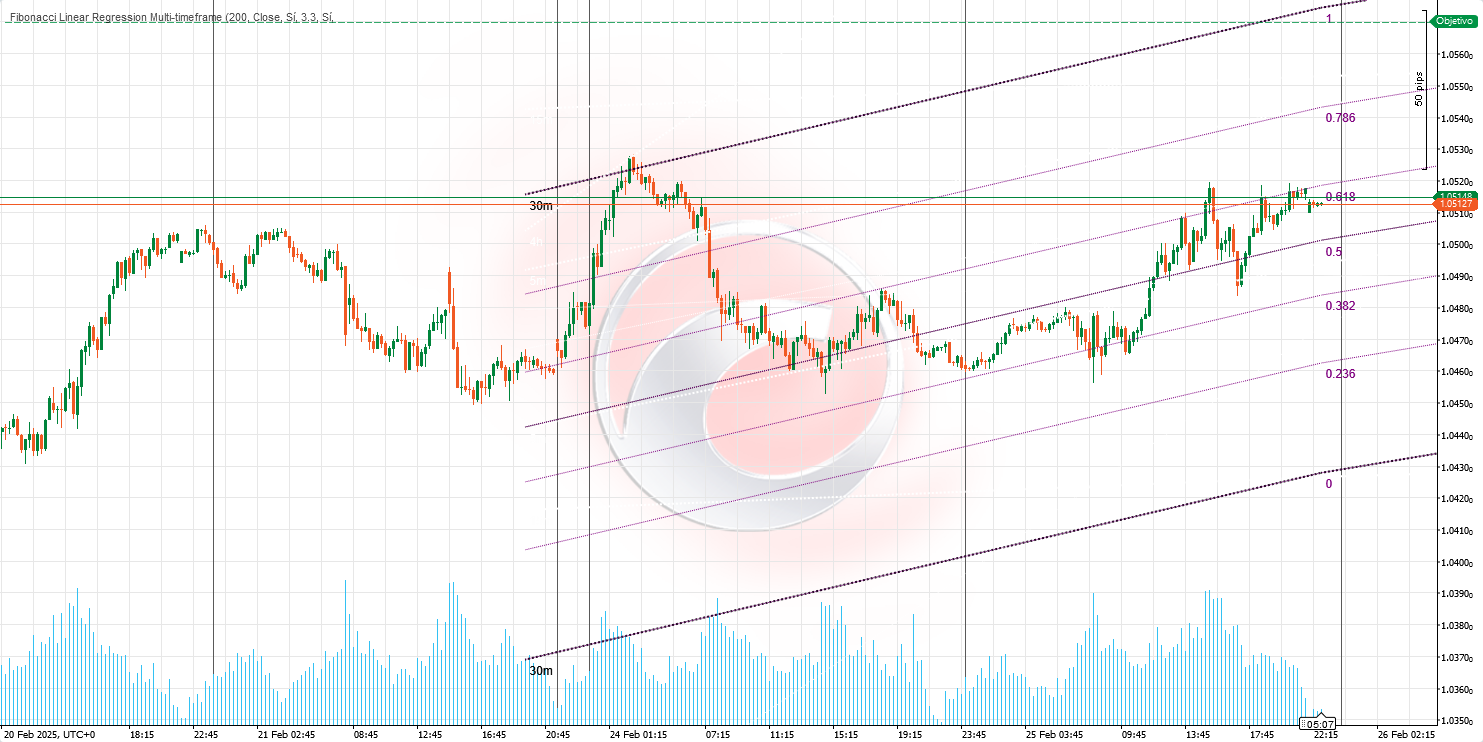
- Multi-Timeframe Analysis: Simultaneous analysis of 5-minute, 15-minute, 30-minute, and 4-hour timeframes, each represented in distinct colors, helps identify zones where multiple timeframes align. 🎨
🔄 Multidimensional Market Analysis
This strategy allows you to view the market from multiple angles, integrating long-term trends with short-term price movements. This approach enables:
- Dynamically adjusting trades as the market evolves. 🔄
- Switching between timeframes as needed. ⏱️
- Capturing large moves within the primary trend. 🚀
- Exploiting smaller fluctuations to optimize entry and exit points. 🎯
🔄 Interaction Between Timeframes
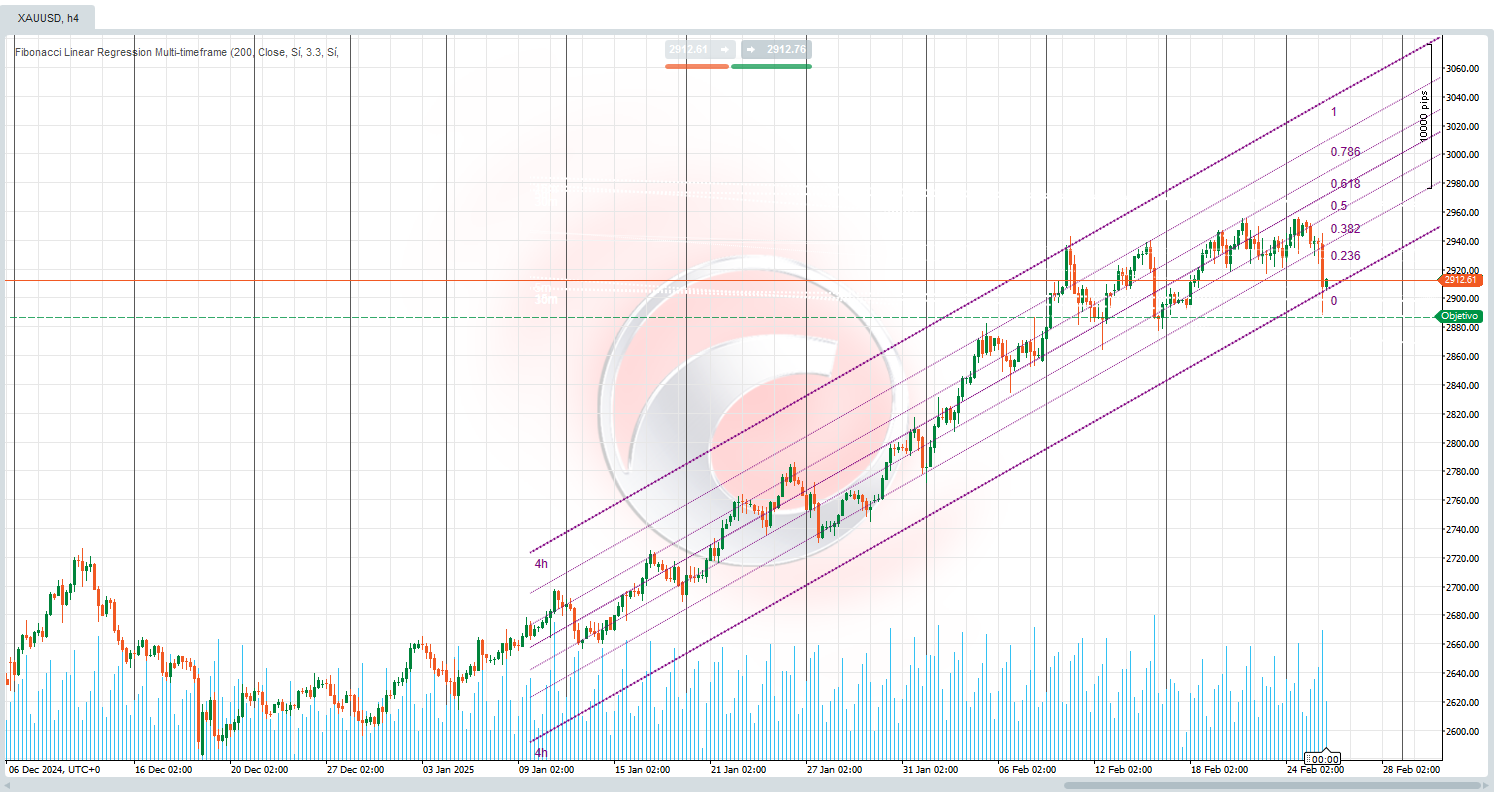
4-Hour Timeframe with Regression Channel
- Provides insight into the dominant trend. 💪
- Offers a solid foundation for assessing general market direction.
- In this context, Fibonacci levels can be disabled to avoid clutter.
- Focus remains on the regression channel showing the prevailing trend.
Lower Timeframes with Regression and Fibonacci
- Activate regression lines and Fibonacci levels on shorter timeframes (5m, 15m, or 30m).
- Obtain more precise signals within the broader trend context.
- Fibonacci levels help identify potential entry and exit points within the larger timeframe.
📊 How to Interpret Results
Identifying Trends
- The direction of the central regression line indicates the dominant trend (bullish, bearish, or sideways). 📈📉➡️
- The slope of the line suggests trend strength—steeper slopes indicate stronger trends. 🔍
- Convergence of regression lines from different timeframes in the same direction signifies a strong and reliable trend.
Support and Resistance Zones
- Upper and lower bands act as dynamic support and resistance zones. 🛡️
- Fibonacci levels within the channel provide additional support/resistance, especially at 0.618 and 0.382.
- When Fibonacci levels from different timeframes align, they create high-probability confluence zones.
🌐 Identifying Confluence Zones
Confluence zones occur where regression lines and Fibonacci levels overlap. These areas represent likely points of significant price reaction:
- When a Fibonacci retracement aligns with the upper or lower edge of a regression channel, it acts as a strong support or resistance point.
- When regression lines from different timeframes intersect or converge.
- When Fibonacci levels from multiple timeframes coincide in a specific area.
- When price bounces precisely at a Fibonacci level that coincides with a regression channel line.
🔄 Identifying Reversal Zones
If the price breaks the regression channel in a smaller timeframe and approaches a key Fibonacci level, it may signal a possible reversal. Additional reversal signs include:
- Overextension: When price reaches or exceeds the upper/lower band, especially when aligned with Fibonacci levels across multiple timeframes.
- Divergence with momentum indicators: Using this indicator alongside RSI, MACD, or others can enhance divergence detection.
- Central Line Break: Crossing the central regression line may signal a change in price dynamics, particularly if it happens across multiple timeframes simultaneously.
🧩 Multiplicity of Scenarios
Using various combinations of regression channels and Fibonacci levels across multiple timeframes can create diverse trading scenarios:
- Maintain a long position on the 4-hour timeframe while simultaneously trading smaller timeframes to capitalize on Fibonacci bounces.
- Identify the primary trend using the 4-hour regression channel and find optimal entries during retracements to Fibonacci levels in smaller timeframes.
- Use confluences across multiple timeframes to confirm high-probability entry and exit points.
📈 Trading Strategies
Reversal Strategy
- Identify zones where multiple Fibonacci levels and bands from different timeframes converge.
- Wait for price confirmation (candlestick patterns, divergences, etc.).
- Enter against the previous trend with a tight stop loss.
- Set targets at the next Fibonacci level or the central regression line.
Continuation Strategy
- Look for retracements to the central line or key Fibonacci levels (0.382 or 0.618).
- Confirm that the overall trend remains intact across multiple timeframes.
- Enter in the direction of the trend when price bounces off these levels.
- Place stop losses below/above the relevant Fibonacci level.
By leveraging the Fibonacci Linear Regression indicator, traders can gain deeper insights into market dynamics and make more informed trading decisions. Stay sharp and trade smart! 💻📈
Ctrader Store indicators:
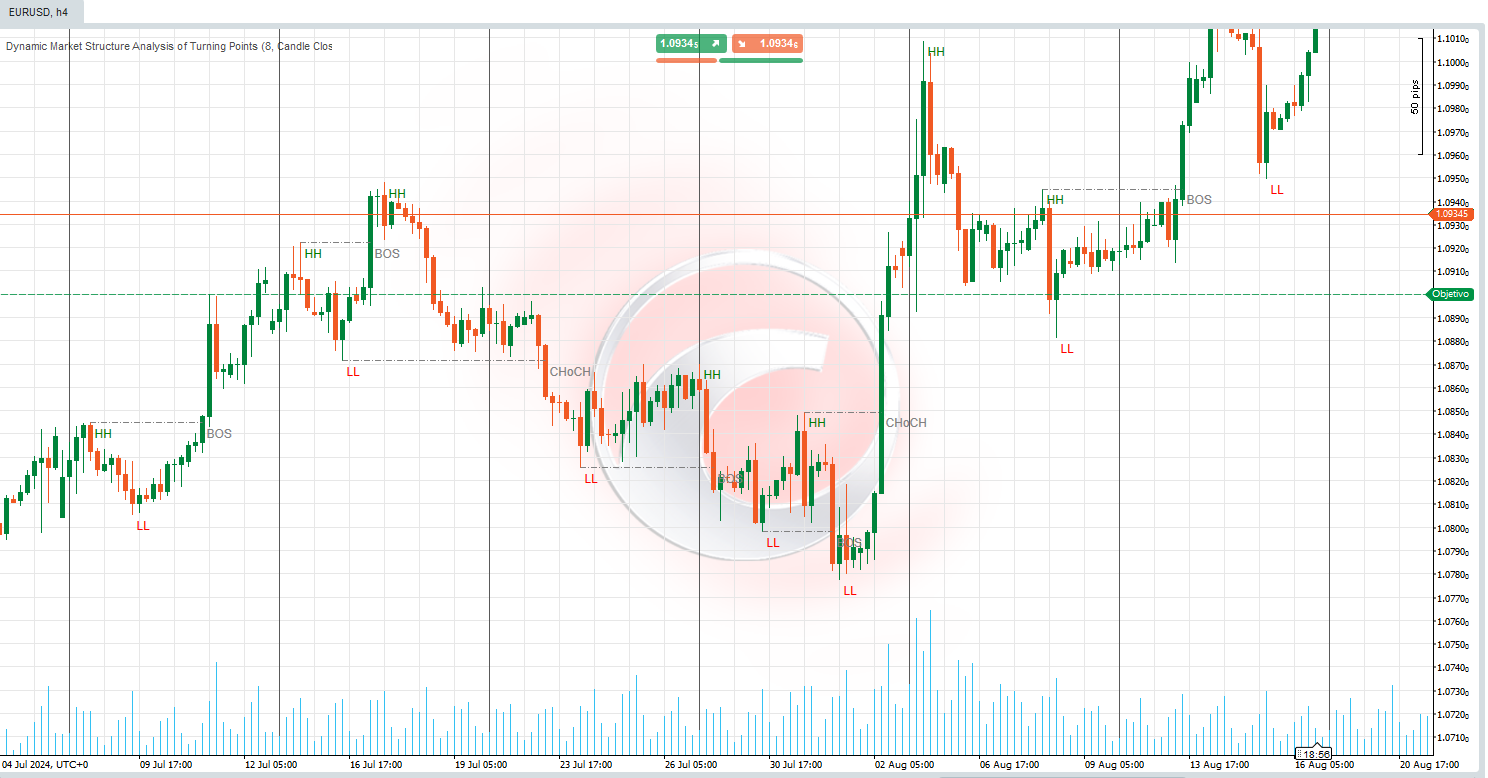
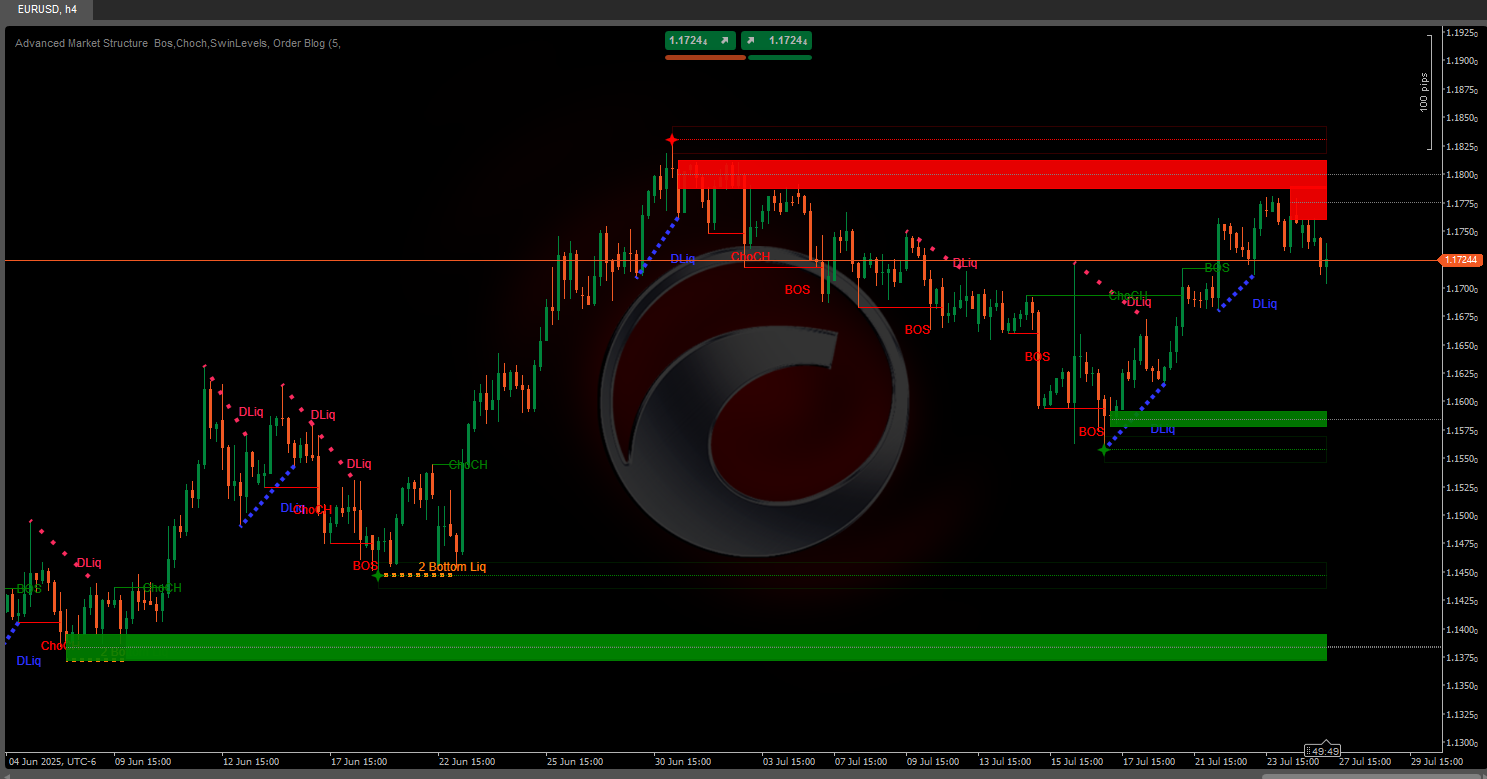
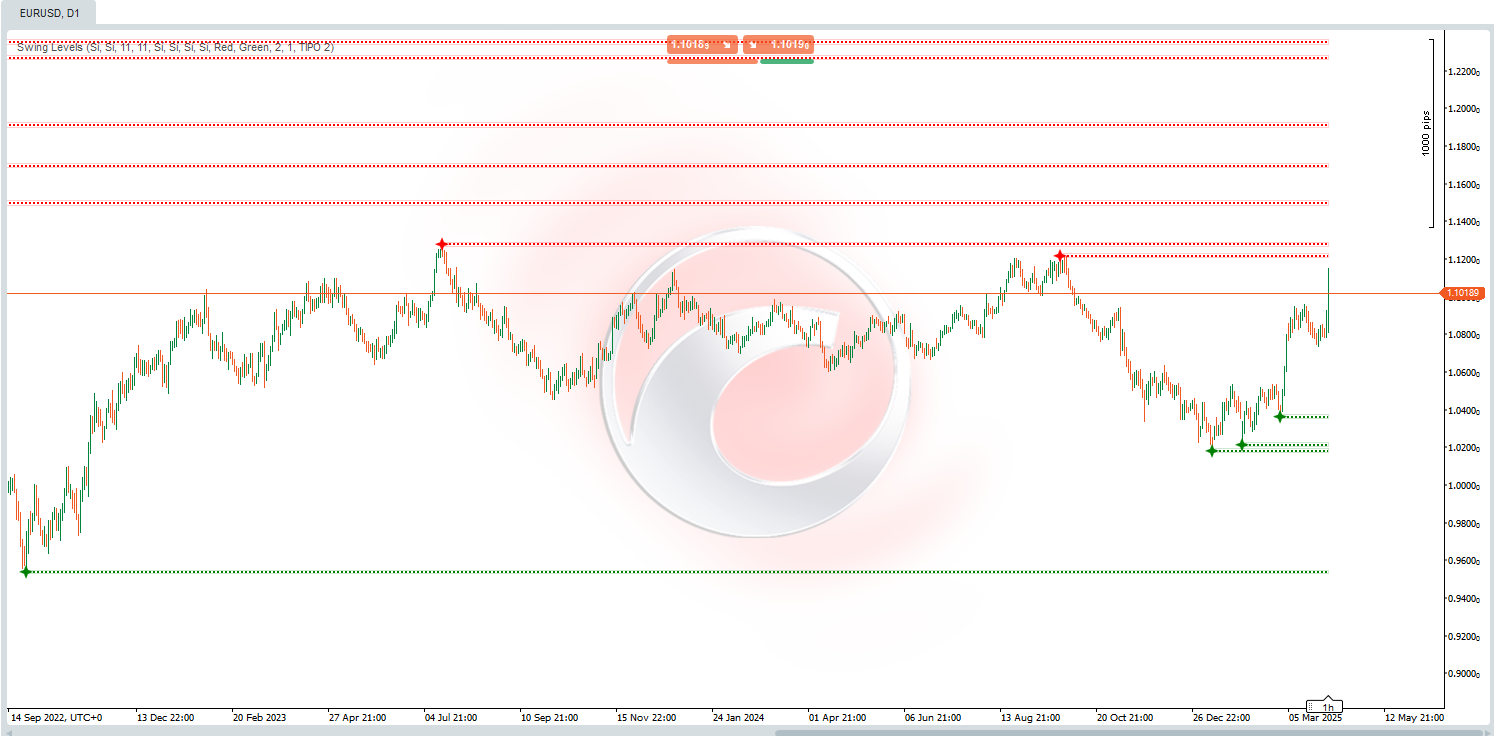
Dynamic Market Structure
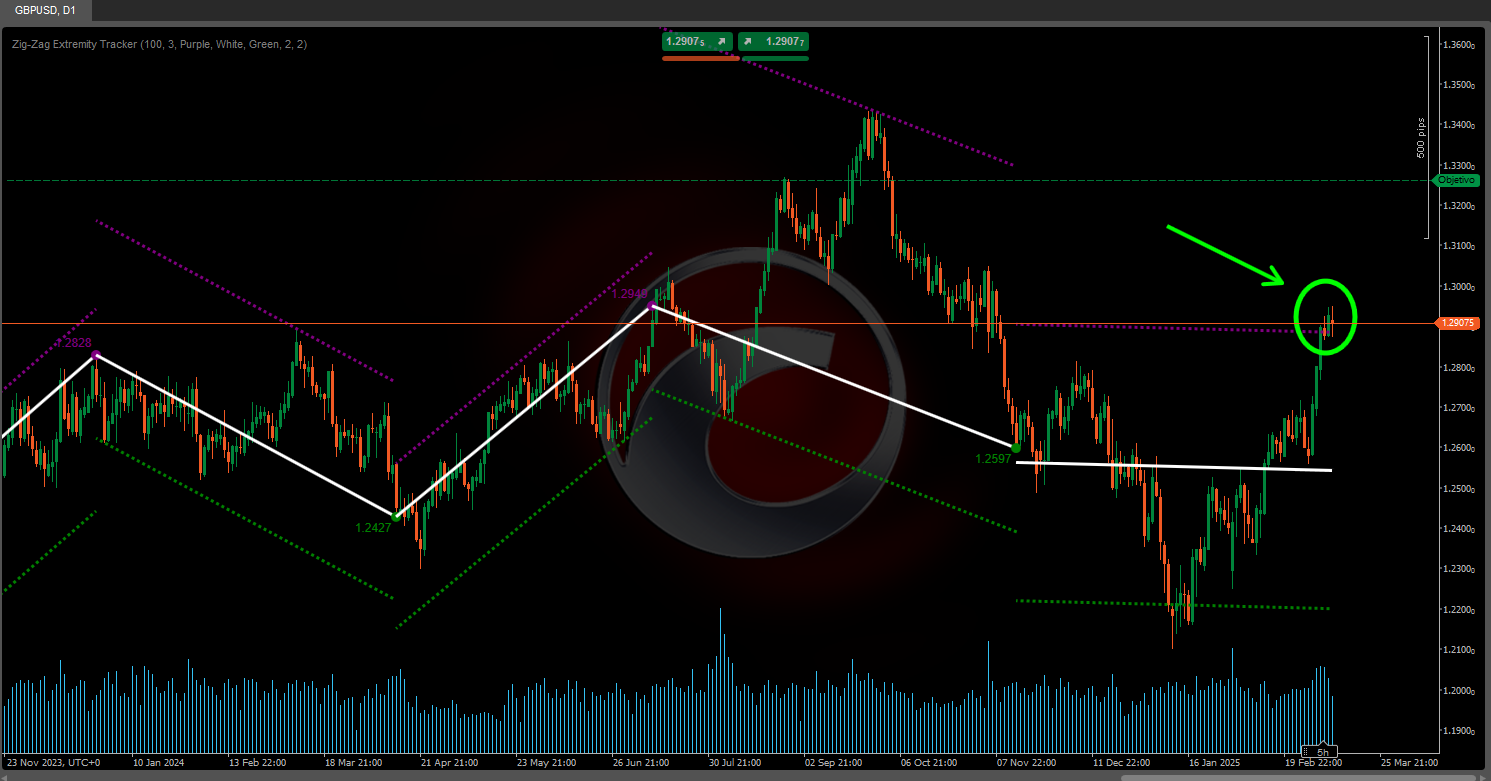
Analysis of Turning Points
Fibonacci Linear
Regression Multi-timeframe
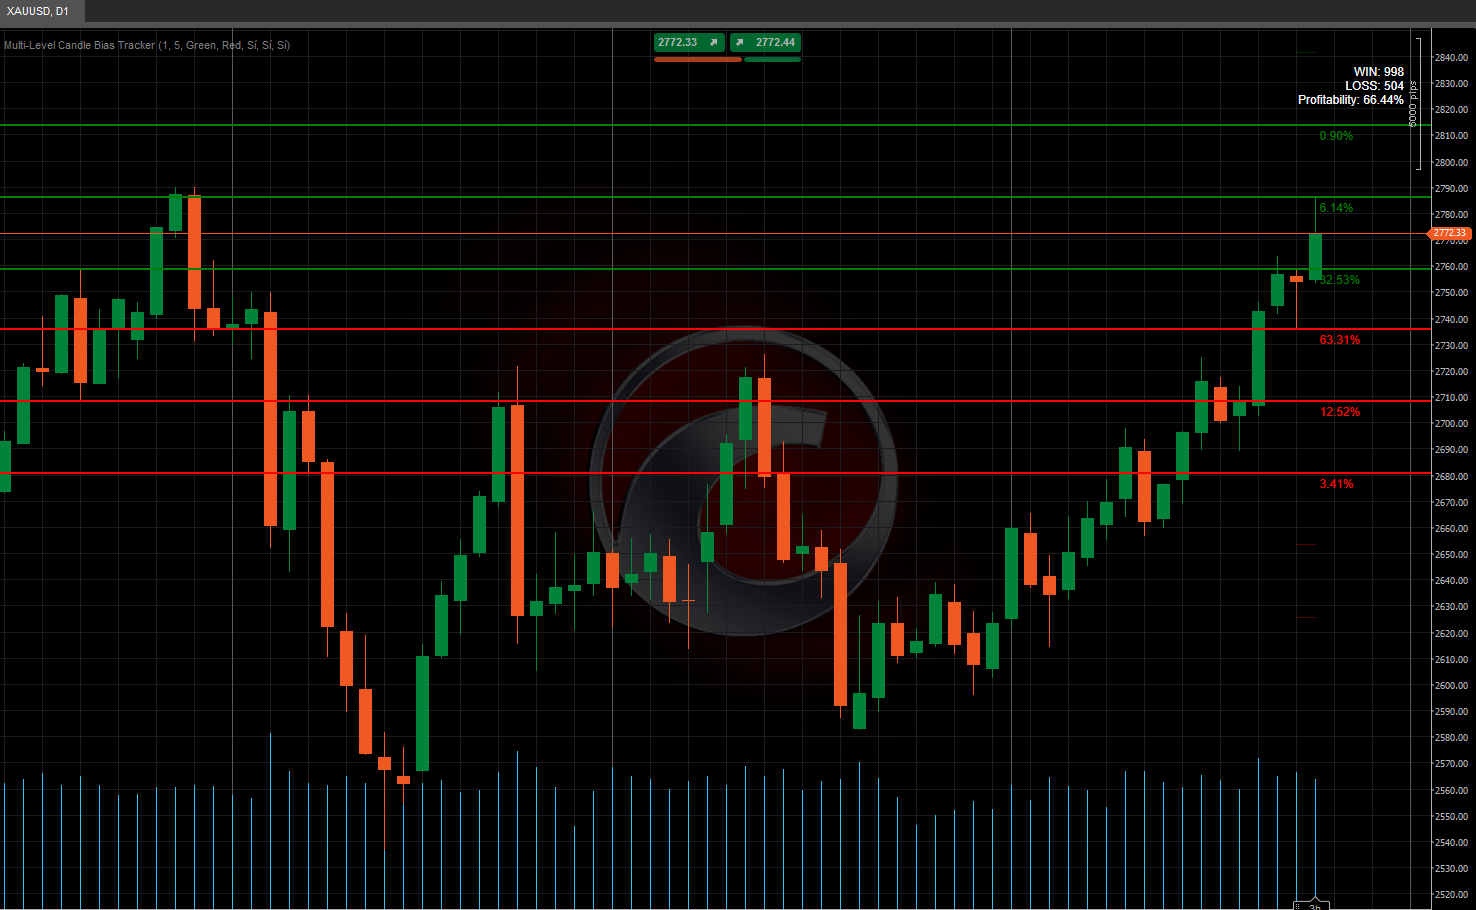
Multi-Level Candle Bias
Tracker
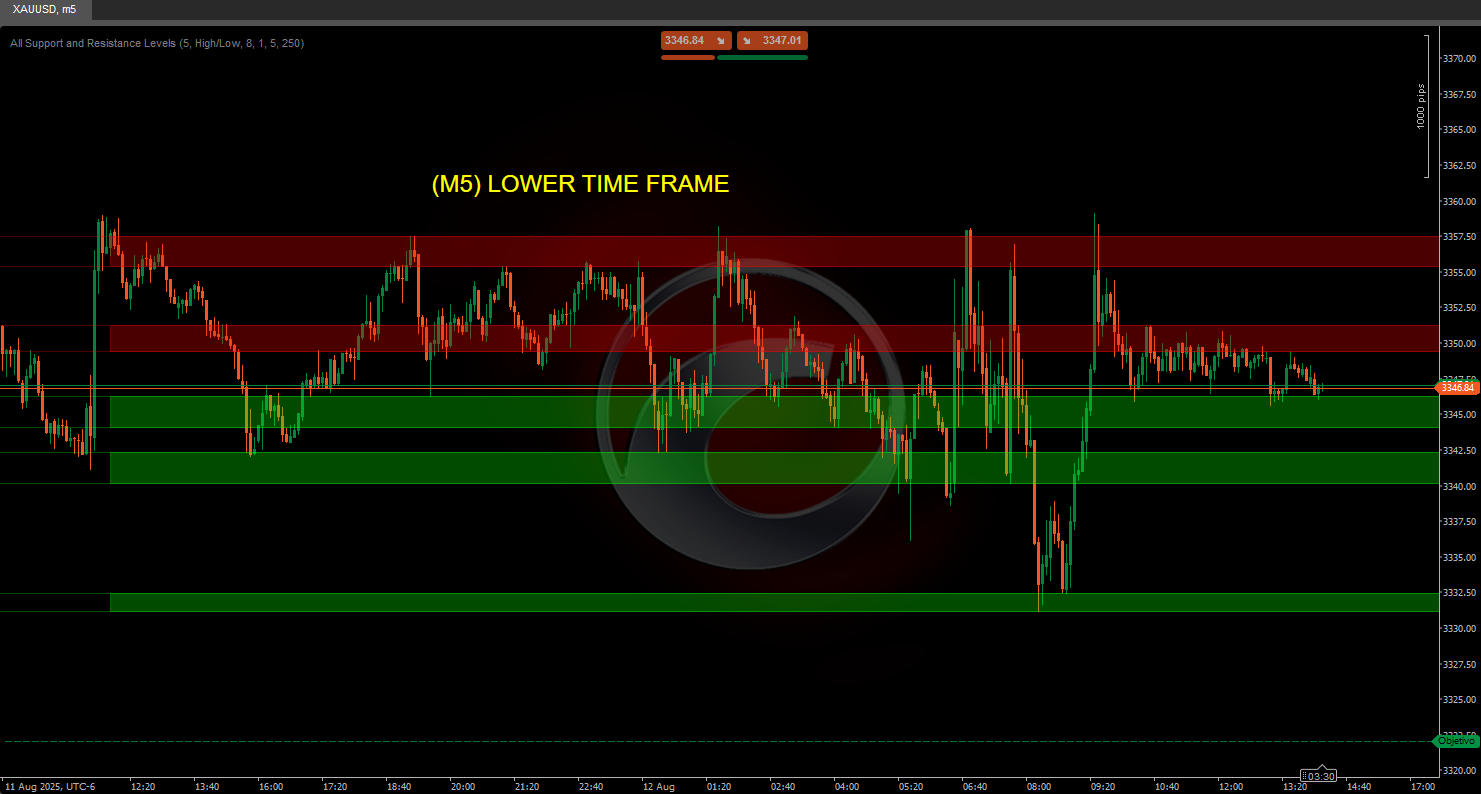
Auto Support and
Resistance Trend Lines


.jpg)


.jpg)