present
Regístrese y obtenga 50 $ de descuento en su primera compra
Trading product for Chart Tools Indicador Signal Breakout, image 1
Chart Tools
Indicador
151 descargas
Versión 1.5, Apr 2026
Windows, Mac
5.0
Valoraciones: 1
Trading product for Chart Tools Indicador Signal Breakout, image 2
Trading product for Chart Tools Indicador Signal Breakout, image 3
Trading product for Chart Tools Indicador Signal Breakout, image 4
Trading product for Chart Tools Indicador Signal Breakout, image 5
Desde 20/12/2024
9.86K
Instalaciones gratis

Descripción

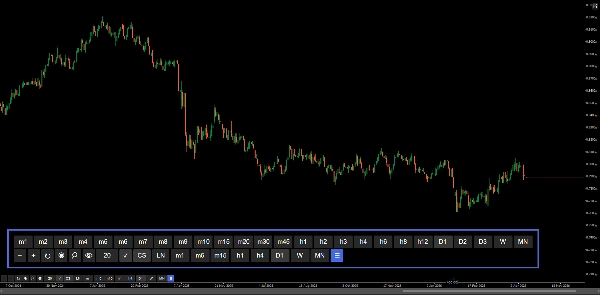
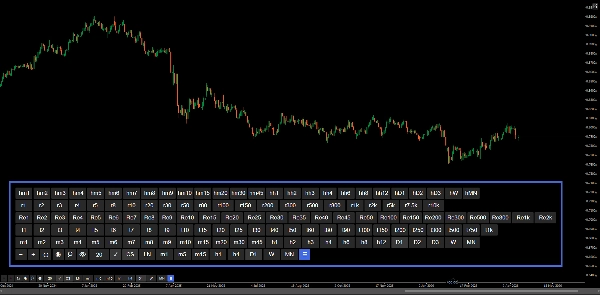
Panel de control del gráfico para una navegación más rápida: zoom, marco temporal y configuración del gráfico sin salir del gráfico.


Preajustes de zoom, entrada manual de zoom, selector completo de marco temporal y gráfico, marcos temporales favoritos configurables, separadores de período, cuadrícula de números redondos y líneas de oferta/demanda en vivo, todo accesible a través de botones de la interfaz en el gráfico. Diseñado para reducir el tiempo dedicado a navegar por los menús nativos de cTrader durante sesiones de trading activas.


CARACTERÍSTICAS


Controles de Zoom

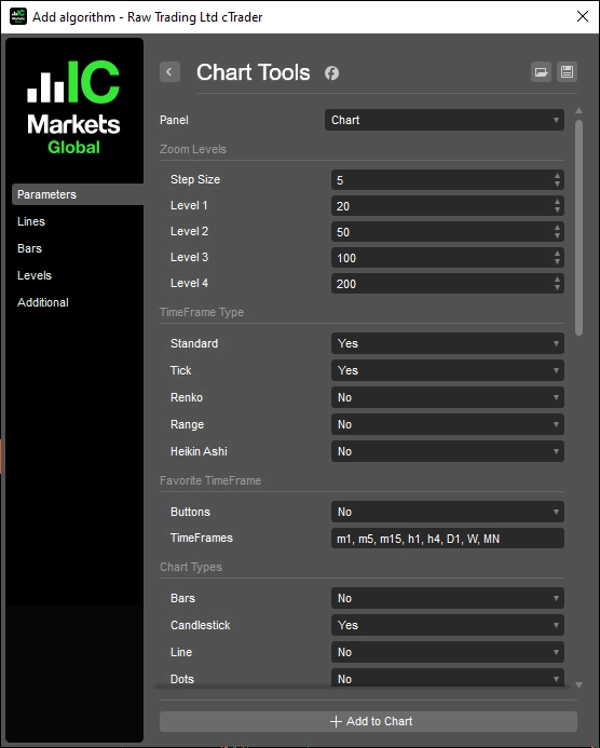
  • Acercar / alejar con tamaño de paso configurable
  • Cuatro niveles de zoom preestablecidos configurables para acceso con un clic
  • Entrada manual de zoom con botón de aplicar
  • Sincroniza con los eventos nativos de zoom de cTrader


Selector de Marco Temporal

  • Panel completo de botones que cubre todos los tipos de marco temporal: Estándar, Heikin Ashi, Renko, Rango, Tick
  • Modo "Todos" muestra cada tipo como filas separadas
  • Marco temporal activo resaltado automáticamente
  • Alternar visibilidad del panel con el botón ☰


Marcos Temporales Favoritos

  • Fila de acceso rápido configurable mediante entrada separada por comas (p. ej., m1, h1, D1)
  • Soporta todos los tipos de marco temporal incluyendo Rango y Tick


Tipo de Gráfico

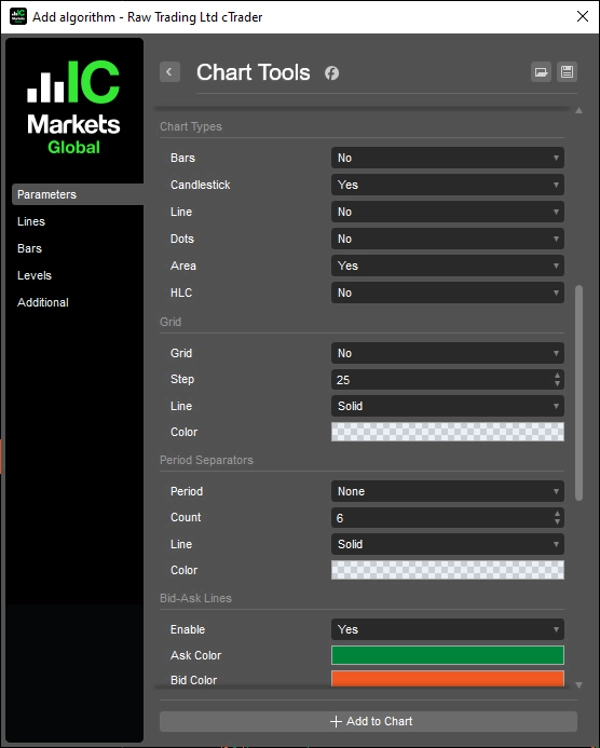
  • Botones de cambio rápido para: Barras, Velas, Línea, Puntos, Área, HLC
  • Tipo de gráfico activo resaltado automáticamente
  • Cada botón configurable individualmente mediante parámetros


Cuadrícula

  • Cuadrícula basada en números redondos con intervalo de pips configurable (Multiplicador)
  • Etiquetas de precio con formato decimal inteligente
  • Las líneas se extienden 10 barras más allá de la última barra
  • Alternar habilitar/deshabilitar


Separadores de Período

  • Separadores diarios, semanales, mensuales y anuales
  • Cantidad, color, estilo de línea y grosor configurables
  • Actualización automática al desplazarse y hacer zoom


Líneas de Oferta/Demanda

  • Líneas de oferta y demanda en vivo que se extienden hasta el infinito
  • Colores configurables para oferta y demanda
  • Alternar habilitar/deshabilitar


Botones

  • Posición: Superior derecha, superior izquierda, inferior derecha, inferior izquierda
  • Margen configurable
  • Colores configurables de botones y texto, incluyendo estado activo, aplicar zoom y botón de alternar gráfico


__________________________________________________________________________________________


MÁS INDICADORES GRATUITOS


Explora una amplia gama de herramientas de análisis de mercado, desde estructura y volumen hasta regresión, volatilidad y marcos temporales personalizados.

El código fuente está disponible en el repositorio de GitHub repository.

Todos son gratuitos para usar. Pero si deseas apoyar con un café, puedes hacerlo aquí.


Soporte/Resistencia


Volumen


Medias Móviles


Utilidades/Personalizados


Basado en Regresión


Volatilidad


Osciladores


__________________________________________________________________________________________


AVISO LEGAL

El trading implica riesgos. Este indicador está destinado únicamente para análisis técnico: siempre aplique una gestión de riesgos adecuada y opere con responsabilidad.


COMENTARIOS Y MEJORAS

Si tienes sugerencias, solicitudes de funciones o ideas para mejoras, por favor deja un comentario en la pestaña de Discusión. Tus comentarios ayudan a mejorar el indicador para todos.

Resumen

AI summary
Chart Tools is a comprehensive chart control panel designed for the cTrader platform to enhance navigation and chart customization without leaving the chart interface. It provides zoom controls with configurable step sizes, four preset zoom levels, and manual zoom entry synchronized with native zoom events. The timeframe selector covers all types including Standard, Heikin Ashi, Renko, Range, and Tick, with an option to toggle panel visibility and highlight the active timeframe automatically.

Users can configure a quick-access row of favorite timeframes supporting all timeframe types. The chart type switcher offers quick buttons for Bars, Candlestick, Line, Dots, Area, and HLC charts, each with individual configuration and automatic active state highlighting.

Additional features include a round numbers-based grid with configurable pip intervals and smart decimal formatting, daily to yearly period separators with customizable appearance, and live bid/ask lines extending indefinitely with color customization and toggle options.

The control panel’s buttons can be positioned in any corner of the chart with configurable margins and colors, including active states and zoom application. This tool aims to streamline active trading sessions by reducing time spent navigating native menus, supporting efficient technical analysis on various chart types and timeframes.
Perfil del indicador

Valoraciones de clientes

5.0
Valoraciones: 1
5
100 %
4
0 %
3
0 %
2
0 %
1
0 %
Valoraciones de clientes
April 29, 2026
Ultimate Productivity Booster for cTrader! This tool is a massive time-saver. The on-chart UI allows for lightning-fast navigation across all timeframe types (Renko, Range, Tick) without digging through menus. I love the customizable zoom presets, round numbers grid, and the seamless integration of live bid/ask lines. It keeps my workspace clean and my execution fast during active sessions. A must-have utility for any professional trader looking to optimize their workflow. Highly recommended!

Conversación

Preguntas frecuentes

Signal
Breakout
Scalping
SMC
Grid
AI
Martingale
Los productos disponibles a través de cTrader Store, incluidos bots, indicadores y plugins para operar, son proporcionados por desarrolladores de terceros y están disponibles únicamente con fines informativos y de acceso técnico. cTrader Store no es un bróker, por lo que no proporciona asesoramiento de inversión, recomendaciones personales ni ninguna garantía de rentabilidad futura.

Más de este autor

Indicador
VWAP
Customizable VWAP with flexible reset, three band methods, and full Fibonacci level control.
Indicador
Fibonacci
Clear pivot levels. Clean S/R zones. Five methods. Any timeframe.
Indicador
Forex
Crypto
+3
Volume distribution analysis with Market Profile TPO integration.
Indicador
Fibonacci
Fair Value Gap
Detect FVGs with age, status, Fibonacci levels, and customizable fill threshold—extended version.
Indicador
Forex
Crypto
+3
Custom and native timeframes display with OHLC lines, moving averages, and Fibonacci levels.
Indicador
Forex
Crypto
+3
VSA indicator analyzing volume, spread, and close location to detect supply/demand imbalances.
Indicador
Breakout
Fibonacci
Track Initial Balance ranges across any period with optional Fibonacci levels and projections.
Indicador
Forex
Crypto
+3
28-method MA library in one indicator — from classic EMAs to adaptive & zero-lag variants.
Indicador
Breakout
Plots automatic psychological levels at round-number zones – major structure & liquidity levels.
Indicador
Forex
Crypto
+3
Volume profiler applying Wyckoff effort vs result and spread analysis with visual bar graphs.
Indicador
Breakout
Fibonacci
Statistically-grounded trend channels via linear regression — clear trend & reversal zones.
Indicador
Forex
Crypto
+3
John Ehlers' trendline using signal processing to filter cycle noise and identify trends with minimal lag.

Puede interesarle

Indicador
Pin Bar
Inducement
+5
Institutional Nasdaq Session Liquidity Map with Live Point HUD, Sweep Alerts & Interactive Playbook.
Indicador
ATR
EMA
+4
Range-filter BUY/SELL signals scored by four confluence layers, with a stop, five targets and a trend panel
Indicador
 this moving include everything that a trader needs from Moving Average.
Indicador
BOS
MSS
+3
Orderblocks with Multi-Timeframe.
Indicador
SMC
BTCUSD
+9
Detects CHoCH breakouts, draws interest zones & auto Fibo. Built for Smart Money & Price Action Engulfing confirmation
Indicador
CHOCH
Inducement
+5
TradeLens - Frame the Trade. Refine the Entry. Two Timeframes. One Decision.
Indicador
Doji
Flag
+5
Angora Pattern Recognition is a cTrader indicator that finds, draws and tracks classic chart patterns automatically.
Indicador
ADX
ATR
+1
Indicador de Sinais Visuais para Spotcrude (WTI) ou SpotBrent com filtros de tendência, operacional de 10 e 15 minutos.
Indicador
RSI
Grid
+16
SectorIndex Dual Moving Average Indicator: Your Market Compass 🧭
Indicador
ATR
RSI
+6
📊Zones Supply & Demand: Identifies key price levels with high volume concentration, marking Supply/Demand Zones & Marke
Indicador
VWAP
Forex
+5
Dynamic Swing Anchored VWAP
Indicador
ATR
SMC
+2
HTF POWER 3 ICT Power of 3 · M1 Precision · H4 Intelligence Auto-detect Accumulation → Manipulation → Distribution
Indicador
ATR
Prop
+6
🟢 Strength-ranked S/R zones with MTF levels and Pro labels. Nearest-zone band and HUD for faster, cleaner entries. 🔴
Indicador
ATR
EMA
+3
EMA trend, RSI reclaim and divergence signals with ATR stop and two targets, swing levels and a 16-row dashboard.
Indicador
ATR
BOS
+4
Based on market structure and draws liquidity zones, institutional flows, and consolidation ranges. Smart Money Concepts
Indicador
AI
ATR
+27
Overbought Oversold Indicator
Indicador
RSI
Forex
+10
Unlock Stochastic RSI PRO in cTrader! Overlay RSI, highlight zones, and identify divergences with customizable settings.
Indicador
SMC
Forex
+7
Simple Smart Money Concepts (SMC)

Precio

Desde 20/12/2024
9.86K
Instalaciones gratis