Deskripsi
Kunci perhitungan moving average pada momen pasar mana pun dan lacak perilaku harga saat bergerak ke depan.
Menetapkan perhitungan pada titik awal pilihan Anda (tanggal dan waktu manual atau periode mundur dari 1 jam hingga 10 tahun), kemudian berkembang secara alami dengan pita Fibonacci adaptif berdasarkan rentang harga aktual.
Delapan level Fibonacci (11,4% hingga 100%) yang menyesuaikan dengan pergerakan harga nyata, zona mean reversion bawaan 38,2%-62,8%, dua jenis MA (SMA/EMA), beberapa mode tampilan (pita penuh, batas ekstrem saja, zona reversion saja), dan pembatas periode maksimum untuk kerangka waktu panjang memberikan pelacakan momentum berbasis peristiwa bagi trader yang menargetkan pullback dari titik ayunan signifikan dan analisis perilaku harga pasca-peristiwa.
FITUR
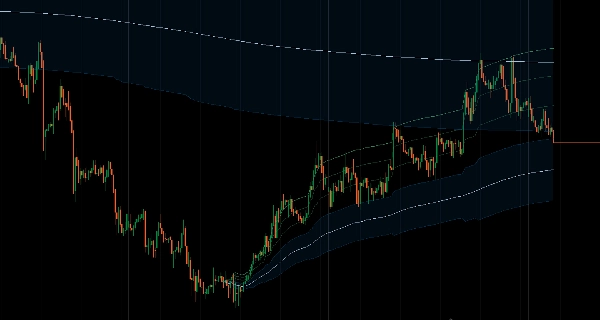
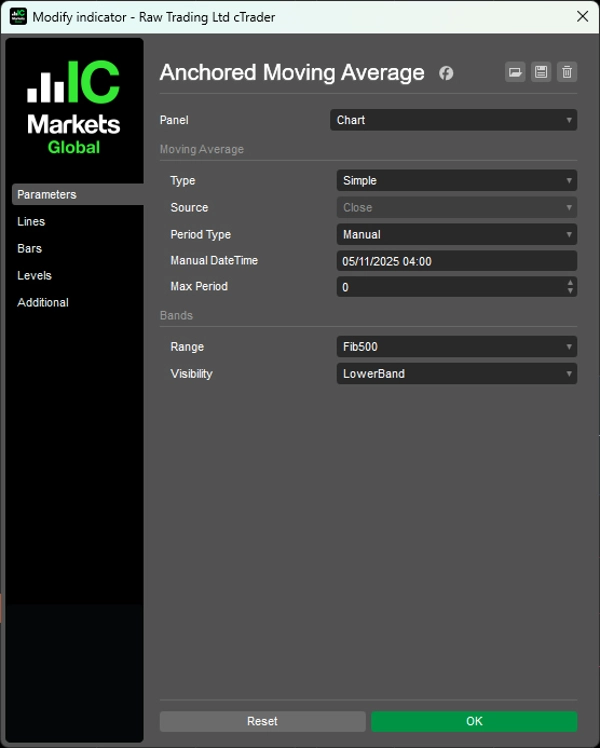
Perhitungan Berjangkar Waktu
- Berbeda dengan MA standar yang menggunakan periode tetap, ini berkembang secara alami dari titik awal pilihan Anda
- Penetapan jangkar yang fleksibel: Tetapkan tanggal dan waktu manual atau gunakan periode mundur yang telah ditentukan (1 jam hingga 10 tahun)
- Lacak momentum dari momen pasar yang signifikan
- Titik jangkar yang konsisten di berbagai kerangka waktu
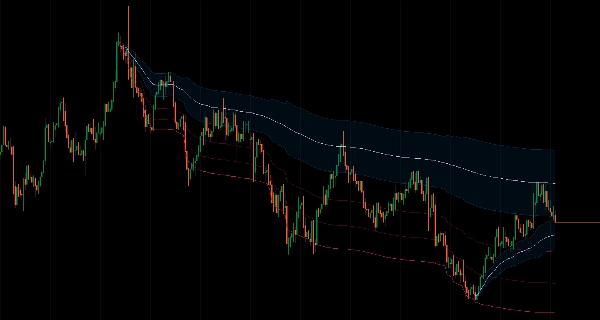
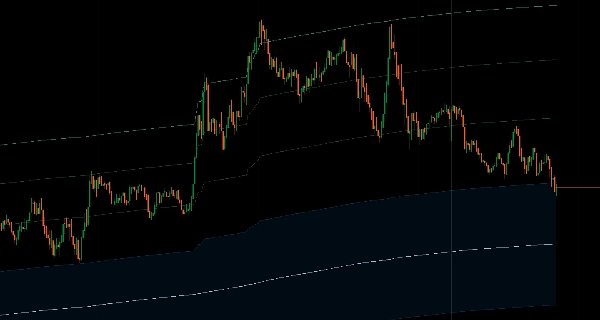
Pita Fibonacci Adaptif
- Pita yang dihitung secara otomatis berdasarkan rentang harga aktual, bukan kelipatan ATR sewenang-wenang
- 8 level Fibonacci (11,4% hingga 100%) yang menyesuaikan dengan pergerakan harga nyata
- Zona mean reversion: Zona reversion 38,2%-62,8% bawaan untuk area masuk dengan probabilitas tinggi
- Zona probabilitas yang didefinisikan secara matematis
Dua Jenis MA
- Simple Moving Average
- Exponential Moving Average
- Pembatas periode maksimum: Mencegah over-smoothing pada kerangka waktu panjang
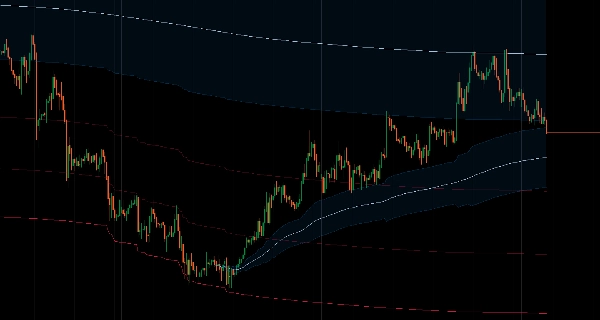
Beberapa Mode Tampilan
- Pita penuh: Semua level Fibonacci terlihat
- Hanya atas/bawah: Tampilkan batas ekstrem
- Hanya zona reversion: Fokus pada area mean reversion
- Desain bersih dan terarah tanpa kekacauan
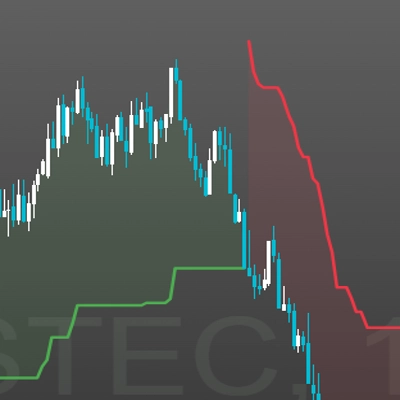
Analisis Berbasis Peristiwa
- Lihat bagaimana harga saat ini terkait dengan pergerakan dari level signifikan
- Lacak perilaku harga pasca-peristiwa
- Entri berbasis struktur dengan titik referensi yang jelas
__________________________________________________________________________________________
INDIKATOR GRATIS LAINNYA
Jelajahi berbagai alat analisis pasar—dari struktur dan volume hingga regresi, volatilitas, dan kerangka waktu khusus.
Kode sumber tersedia di repository GitHub.
Semua gratis untuk digunakan. Namun jika Anda ingin memberikan dukungan kopi, Anda dapat mengarahkannya di sini.
Support/Resistance
Volume
- Volume Activity Profiler
- Volume Efficiency Analyzer
- Volume Profile Analytics
- Volume Profile - Updated
- Volume Spread Analysis
- VWAP (Volume Weighted Average Price)
Moving Averages
- SSL Channel
- Anchored Moving Average
- Deviation-Scaled Moving Average
- Gann High Low Activator
- Instantaneous Trendline
- Kaufman Adaptive MA with Trend Vision
- Moving Average Channel
- Moving Averages Suite
- Trend Channel Moving Average
Utilities/Custom
Regression-Based
Volatilitas
Osilator
__________________________________________________________________________________________
PENYANGKALAN
Perdagangan melibatkan risiko. Indikator ini dimaksudkan hanya untuk analisis teknikal — selalu terapkan manajemen risiko yang tepat dan berdagang dengan bertanggung jawab.
MASUKAN & PENINGKATAN
Jika Anda memiliki saran, permintaan fitur, atau ide untuk peningkatan, silakan tinggalkan komentar di tab Diskusi. Masukan Anda membantu meningkatkan indikator untuk semua orang.
Ringkasan
The indicator features adaptive Fibonacci bands calculated based on the actual price range, not arbitrary multiples. It includes eight Fibonacci levels from 11.4% to 100%, with a built-in mean reversion zone between 38.2% and 62.8%, providing mathematically defined probability zones for potential entry areas. Multiple display modes are available, including full bands, extreme boundaries only, or reversion zone only, designed for a clean and purposeful chart presentation.
This tool facilitates analysis of price behavior relative to significant swing points or events, supporting structured entries and post-event price tracking. It is intended for technical analysis and includes a disclaimer advising responsible trading with proper risk management.
Ulasan pelanggan
5 | 100 % | |
4 | 0 % | |
3 | 0 % | |
2 | 0 % | |
1 | 0 % |