
Deskripsi
VERSI DITINGKATKAN TERSEDIA — DI SINI
Anda saat ini melihat versi asli. Versi diperluas dari indikator ini telah dirilis dengan fitur tambahan:
- Tampilan Usia yang Ditingkatkan: Format tahun, bulan, minggu, hari (misalnya, "3y 2w 4d")
- Tampilkan Semua FVG: Atur "FVG to Display" ke -1 untuk menampilkan FVG historis tanpa batas
- Perpanjang FVG yang Terisi: Opsi untuk memperpanjang kotak FVG yang terisi hingga bar saat ini
- Level Fibonacci: Level otomatis (23,6%, 38,2%, 50%, 61,8%, 78,6%) pada FVG parsial dan terisi
- Ambang Batas Isi Parsial: Ambang batas yang dapat disesuaikan (50-99%, default 90%)
__________________________________________________________________________________________
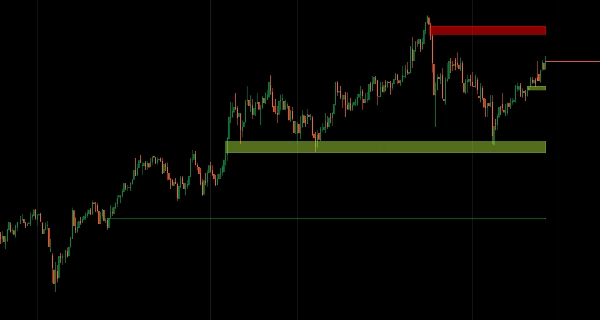
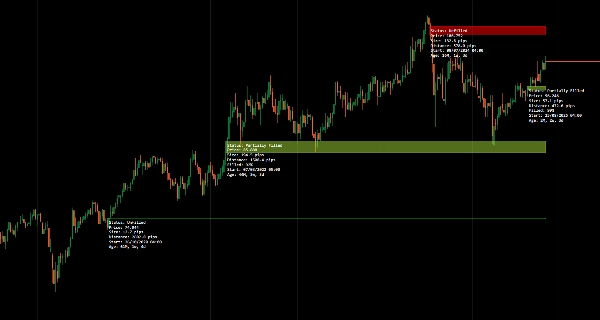
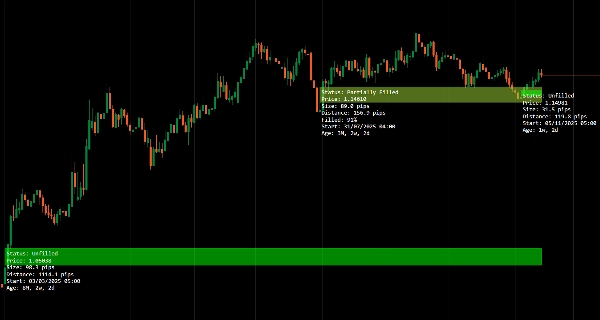
Identifikasi Fair Value Gaps dengan pelacakan usia dan pemantauan status pengisian.
Secara otomatis mendeteksi gap bullish dan bearish, melacak perilaku pengisian mereka (belum terisi, parsial, terisi penuh) secara real-time, dan menampilkan usia gap untuk prioritas.
Pemindaian multi-timeframe untuk menyelaraskan gap struktural HTF dengan aksi harga LTF, pembaruan status dinamis saat harga berinteraksi dengan zona, dan pelabelan minimal yang tidak mengganggu memberikan analisis ketidakseimbangan likuiditas yang terfokus bagi trader yang menargetkan pengisian gap dan entri berbasis struktur.
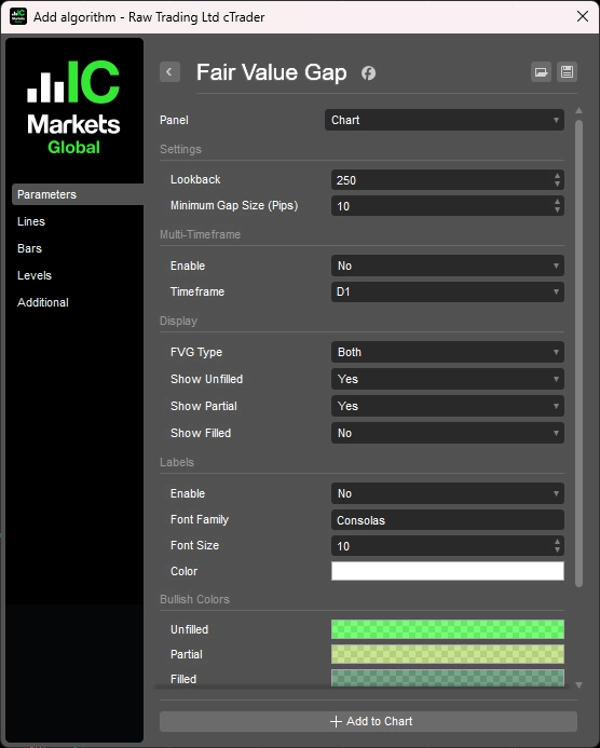
FITUR
Identifikasi FVG
- Secara otomatis mendeteksi Fair Value Gaps bullish dan bearish
- Melacak status belum terisi, terisi sebagian, dan terisi penuh secara real-time
- Plot visual yang bersih dengan gangguan grafik minimal
Pelabelan Usia
- Menampilkan berapa lama waktu yang telah berlalu sejak setiap gap terbentuk
- Membantu memprioritaskan gap segar vs. basi untuk pemilihan perdagangan
- Konteks waktu meningkatkan pengambilan keputusan tentang relevansi gap
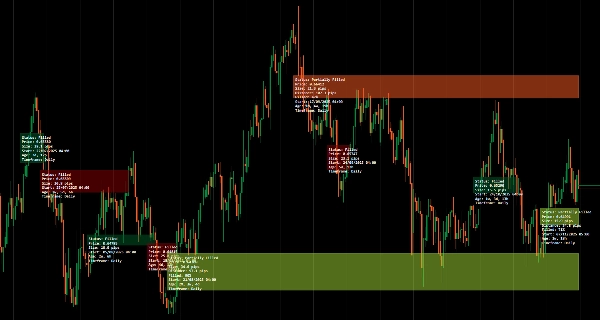
Pelacakan Status
- Menampilkan status pengisian saat ini: belum terisi, terisi sebagian, atau terisi penuh
- Memperbarui secara dinamis saat harga berinteraksi dengan gap
- Konfirmasi visual dari penangkapan likuiditas
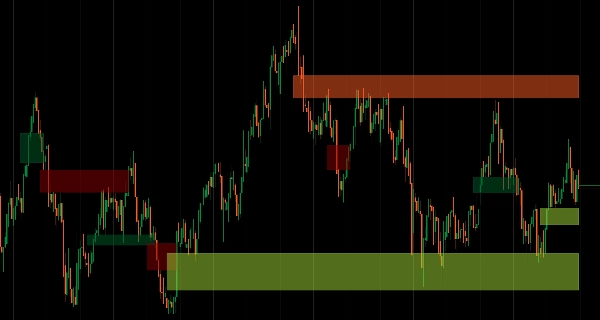
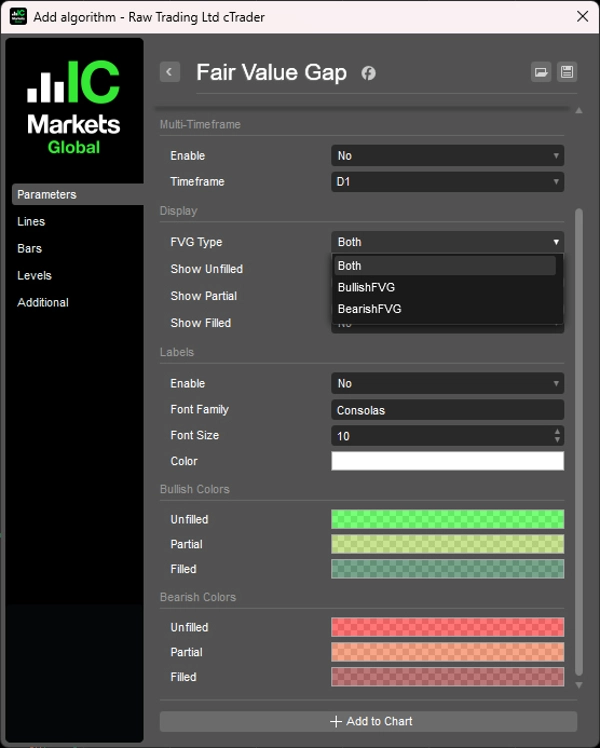
Mode Multi-Timeframe
- Pindai dan tampilkan FVG timeframe lebih tinggi pada grafik timeframe lebih rendah
- Menyelaraskan gap struktural HTF dengan aksi harga LTF
- Meningkatkan alur kerja analisis multi-timeframe
UI Bersih dan Minimal
- Label yang tidak mengganggu dirancang untuk kejelasan
- Informasi tanpa mengacaukan tampilan harga Anda
- Presentasi profesional untuk analisis yang terfokus
__________________________________________________________________________________________
INDIKATOR GRATIS LAINNYA
Jelajahi berbagai alat analisis pasar—dari struktur dan volume hingga regresi, volatilitas, dan timeframe kustom.
Kode sumber tersedia di repositori GitHub repository.
Semua gratis untuk digunakan. Tetapi jika Anda ingin mengirim dukungan kopi, Anda dapat mengarahkannya di sini.
Support/Resistance
Volume
- Volume Activity Profiler
- Volume Efficiency Analyzer
- Volume Profile Analytics
- Volume Profile - Updated
- Volume Spread Analysis
- VWAP (Volume Weighted Average Price)
Moving Averages
- Anchored Moving Average
- Deviation-Scaled Moving Average
- Instantaneous Trendline
- Kaufman Adaptive MA with Trend Vision
- Moving Average Channel
- Moving Averages Suite
- Trend Channel Moving Average
Utilities/Custom
Regression-Based
Volatilitas
Oscillators
__________________________________________________________________________________________
PENAFIAN
Perdagangan melibatkan risiko. Indikator ini dimaksudkan hanya untuk analisis teknis — selalu terapkan manajemen risiko yang tepat dan berdaganglah dengan bertanggung jawab.
UMPAN BALIK & PENINGKATAN
Jika Anda memiliki saran, permintaan fitur, atau ide untuk peningkatan, silakan tinggalkan komentar di tab Diskusi. Umpan balik Anda membantu meningkatkan indikator untuk semua orang.
Ringkasan
Ulasan pelanggan
5 | 100 % | |
4 | 0 % | |
3 | 0 % | |
2 | 0 % | |
1 | 0 % |


