Descrizione
Pinescritlabs
Indicatori Ctrader Store: 🤖cBot Pinescritlabs Ctrader Store:
Fair Value Gap Sessions Gold & BTC Breakout Session Pivots
Dynamic Market Structure
Analisi dei Punti di Inversione
Fibonacci Linear
Regressione Multi-timeframe
Multi-Level Candle Bias
Tracker
Auto Support and
Resistance Trend Lines
All Support and
Resistance Levels
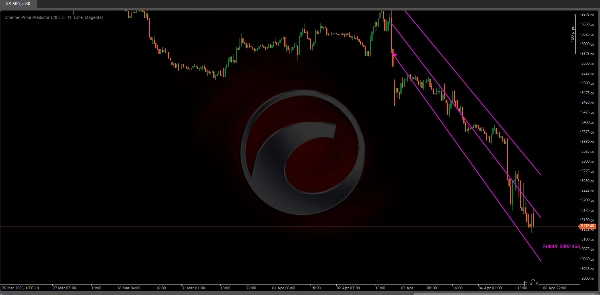
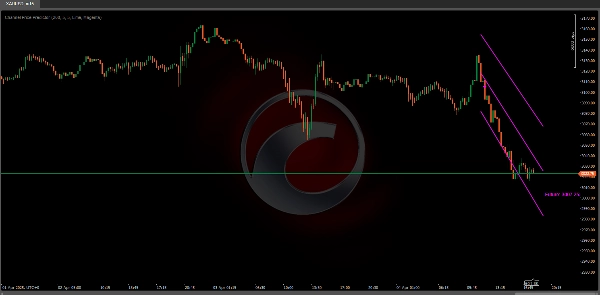
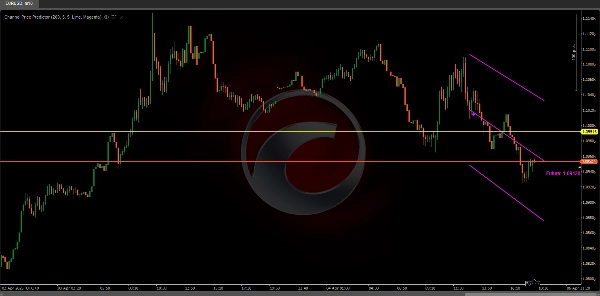
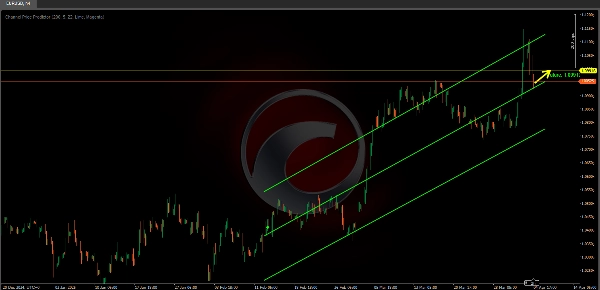
Il Channel Price Predictor identifica e disegna un canale di tendenza (sia rialzista che ribassista) sul grafico, estendendolo nel futuro per anticipare possibili zone di prezzo. 📈🔮
Il canale si basa sull'ATR (Average True Range), che misura la volatilità del mercato. Più alta è la volatilità recente, più ampio è il canale, aiutando a visualizzare l'intervallo dei movimenti probabili. 📊💥
Identifica e disegna automaticamente i canali basandosi sui pivot alti e bassi.
Opzione per estendere le linee del canale e proiettare il loro prezzo futuro. 🕒📉
Questo canale non mostra solo il movimento attuale ma fornisce anche una proiezione stimata del prezzo futuro tramite un'etichetta (“Futuro: …”) che indica il possibile valore del prezzo. 📅💡
A cosa serve?
Identificazione della Tendenza:
L'indicatore utilizza una logica interna per rilevare quando il mercato passa da rialzista a ribassista (o viceversa). In questo modo, puoi visualizzare più chiaramente se l'asset è in una fase ascendente o discendente. 📈🔄📉
Canali di Volatilità:
Il canale si basa sull'ATR (Average True Range), che misura la volatilità. Più alta è la volatilità recente, più ampio è il canale. Questo ti aiuta a vedere l'intervallo dei movimenti probabili. 📊🔍
Proiezione Futura:
L'indicatore non mostra solo la tendenza attuale ma estende il canale di alcuni periodi avanti (configurabile), così puoi anticipare possibili zone di supporto/resistenza all'interno di quella tendenza. ⏳🚀
Ti permette di estendere le linee del canale e proiettare il loro prezzo futuro. ⬆️⬇️
Riferimenti di Prezzo:
Disegnando la linea centrale e i bordi superiore e inferiore, ti fornisce riferimenti per posizionare i tuoi stop, target o anche per gestire entrate/uscite con più informazioni sulla volatilità. 🎯📍
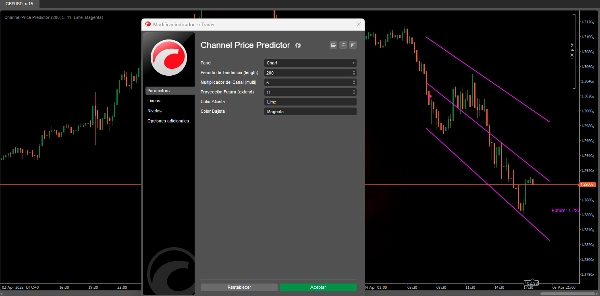
A causa delle limitazioni di cTrader, attualmente non è possibile scorrere verso destra sul grafico per visualizzare correttamente le estensioni future del canale.
Si consiglia di impostare il parametro “Future Projection” a un valore inferiore a 25 periodi per evitare problemi di visualizzazione.
Una volta che cTrader implementerà la possibilità di estendere il grafico nel futuro, apporteremo miglioramenti all'algoritmo per sfruttare appieno questa funzionalità.
Riepilogo
Key features include automatic detection of trend direction changes, visualization of current trend channels, and the ability to extend channel lines into the future. This future projection helps anticipate potential support and resistance zones by displaying estimated price values labeled as “Future: …”. The indicator draws a central line along with upper and lower channel boundaries, providing reference points for placing stops, targets, and managing trade entries and exits with volatility context.
Users can configure the number of periods for future projection, with a recommended maximum of 25 periods to avoid display issues due to cTrader platform limitations. The indicator supports analysis of various markets including cryptocurrencies (e.g., BTCUSD), commodities (e.g., XAUUSD), and others where volatility and trend identification are relevant.
Recensioni dei clienti
5 | 100 % | |
4 | 0 % | |
3 | 0 % | |
2 | 0 % | |
1 | 0 % |


![Logo di "Tabajara corrigido[fix]"](https://cdn.ctrader.com/image/webp/7f4bbef8-b245-4ebd-80d7-582fffc0c90c_28378)