
Opis
Wskaźniki Pinescriptlabs Store: 🤖Pinescriptlabs Store cBoty:
SmartTrend Linia wsparcia i oporu Gold & BTC Breakout Session Pivots(nowy) YieldShield" 🛡️
Dynamiczna struktura rynku
Analiza punktów zwrotnych
Fibonacci liniowy
Regresja wieloczasowa
Momentum luka wartości godziwej
Wielopoziomowe nastawienie świec
Tracker
Automatyczne linie wsparcia i
oporu trendu
Wszystkie poziomy wsparcia i
oporu
ICT POWER OF 3 ⚡📊
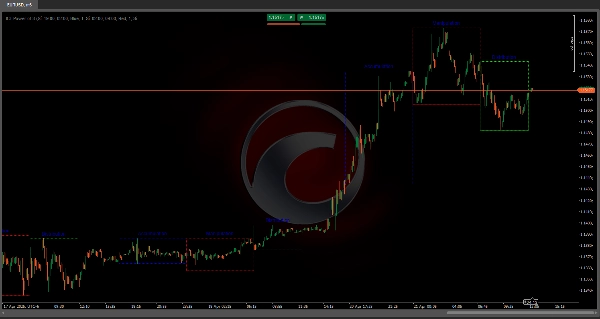
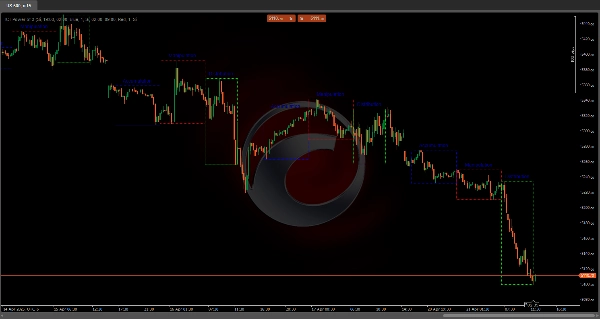
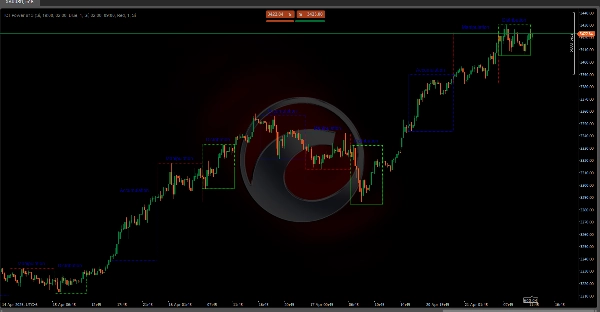
Ten wskaźnik automatyzuje teorię ICT "Power of 3" poprzez naniesienie na wykres trzech kluczowych stref rynkowych—Akumulacji, Manipulacji i Dystrybucji—używając dopracowanych ram czasowych, które obejmują zarówno czyste sesje, jak i ich nakładki. Efektem jest wizualna "mapa" 🗺️ pokazująca, gdzie duzi gracze ustawiają wsparcia, polują na stop lossy i napędzają trendy—bez potrzeby ręcznej analizy świec czy knotów!
Dlaczego ten algorytm jest ważny w handlu 💡
Widoczność instytucjonalna 👀: Automatyzując wykrywanie stref, gdzie "Smart Money" akumuluje, manipuluje i dystrybuuje, eliminujesz zgadywanie i natychmiast widzisz, gdzie płynie prawdziwa płynność.
Wykrywanie pułapek i płynności 🎯: Faza Manipulacji (nakładka Europa-NY) to miejsce, gdzie polowania na stop lossy mają miejsce—ich wykrycie pozwala na wejście w transakcje z niższym ryzykiem.
Potwierdzenie trendu 🚀: Czysta strefa dystrybucji NY uchwytuje sedno momentum kierunkowego—handel zgodny z nim zwiększa wskaźniki sukcesu.
Spójność 🔄: Używanie stałych ram czasowych i ustandaryzowanych wizualizacji eliminuje emocjonalne uprzedzenia i upraszcza testy wsteczne.
Wykrywanie trzech faz (skupienie na nakładkach) 🔍
1️⃣ Akumulacja (nakładka Azja + Tokio/Londyn: 19:00 – 2:00 EST)
- Start ⏳: Przy pierwszej świecy 19:00 EST otwiera się "pudełko", obejmujące początkowy najwyższy/najniższy poziom.
- Śledzenie 🔄: Jeśli cena przebije zakres (nowy najwyższy/najniższy poziom), pudełko rozszerza się w czasie rzeczywistym.
- Zamknięcie 🚪: O godzinie 2:00 EST pudełko zostaje zablokowane, oznaczając miejsce, gdzie Smart Money pochłonęło zlecenia przy niskiej zmienności.
2️⃣ Manipulacja (nakładka Europa + Londyn/NY: 2:00 – 9:00 EST)
- Start ⏳: Wykrywana przy pierwszej świecy 2:00 EST.
- Zachowanie 🎭: Podkreśla fałszywe wybicia poprzednich ekstremów—każde odrzucenie jest wizualnie śledzone.
- Zamknięcie 🚪: Kończy się o 9:00 EST, ujawniając miejsca, gdzie polowania na stop lossy były skoncentrowane.
3️⃣ Dystrybucja (czysta sesja NY: 9:00 – 14:00 EST)
- Start ⏳: Zaczyna się od świecy 9:00 EST.
- Ewolucja 📈: Pudełko rośnie wraz z najszybszym trendem—gdzie instytucje uwalniają pozycje.
- Zamknięcie 🚪: Kończy się o 14:00 EST, oznaczając fazę najwyższego momentum i wolumenu.
Zarządzanie dniem i automatyczne czyszczenie 🧹
Aby uniknąć zaśmiecenia wykresu, wskaźnik przechowuje tylko ostatnie N dni (konfigurowalne). Po przekroczeniu tej liczby automatycznie usuwa stare strefy—granice, wypełnienia i etykiety—utrzymując Twoją analizę czystą i skupioną na najnowszych danych.
Podsumowanie
The indicator identifies:
1. Accumulation phase (7 PM – 2 AM EST, Asia + Tokyo/London overlap), marking where smart money absorbs orders with low volatility.
2. Manipulation phase (2 AM – 9 AM EST, Europe + London/New York overlap), highlighting false breakouts and stop hunts.
3. Distribution phase (9 AM – 2 PM EST, pure New York session), showing where institutions release positions during the highest momentum and volume.
ICT Power of 3 enhances trading by providing institutional visibility, trap and liquidity detection, and trend confirmation. It uses fixed timeframes and standardized visuals to reduce emotional bias and simplify backtesting. The indicator also manages chart clutter by automatically deleting old zones beyond a configurable number of days, keeping the analysis focused on recent data. It supports markets including commodities, cryptocurrencies (BTC, ETH), and symbols like BTCUSD and XAUUSD.
Opinie klientów
5 | 100 % | |
4 | 0 % | |
3 | 0 % | |
2 | 0 % | |
1 | 0 % |


![Logo „[Stellar Strategies] Smart ADX”](https://cdn.ctrader.com/image/webp/af13b084-b6f6-41db-b7bc-c7e688b57b05_36929)


