

설명
OVERVIEW
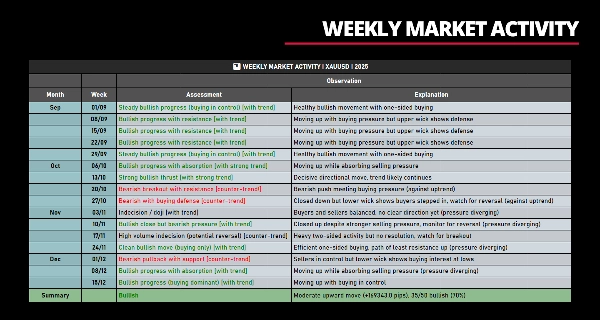
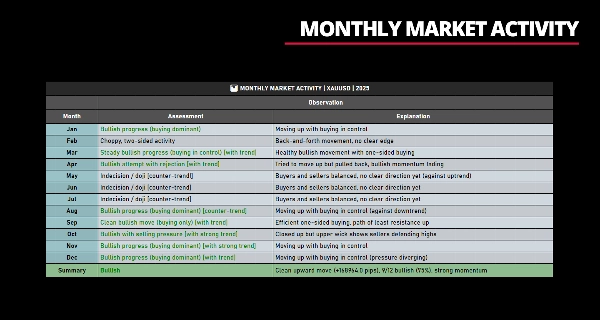
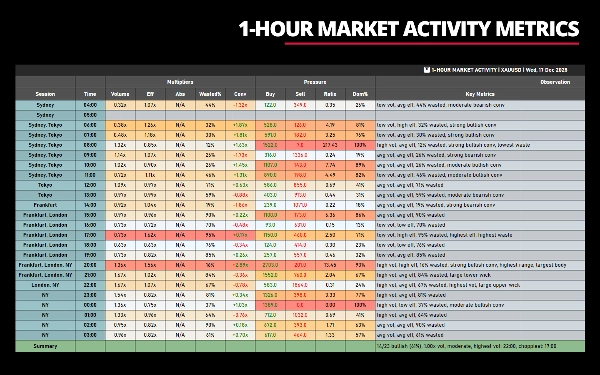
Volume Efficiency Analyzer is a comprehensive bar-by-bar analysis tool that measures the relationship between volume (effort) and price movement (result). It was originally built for personal use to answer a specific question: "Is the market moving efficiently, or is there a lot of activity without meaningful progress?"
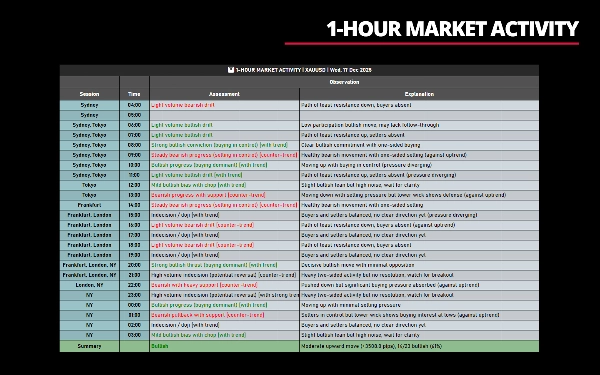
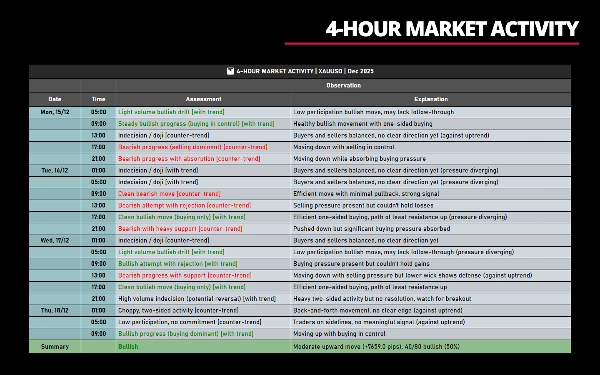
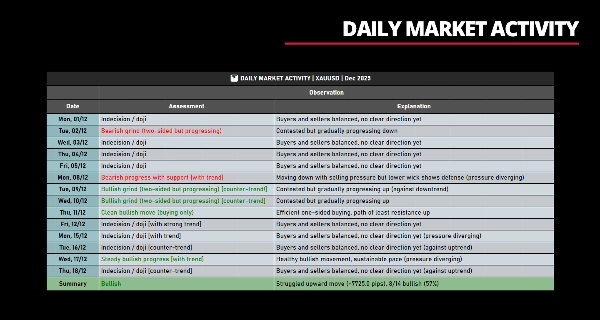
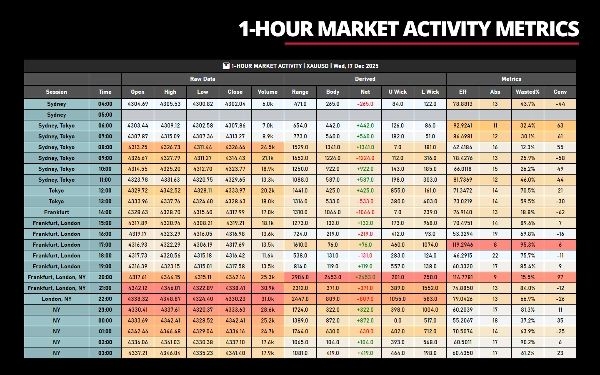
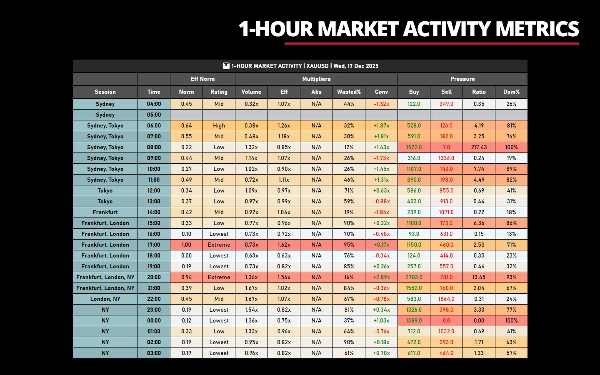
This indicator DOES NOT produce any chart outputs. It displays statistical analysis and metrics in table format only—no lines, signals, or price overlays. These metrics measure and quantify the quality and characteristics of price action and market behavior, helping you understand whether moves are decisive, exhausted, contested, or indecisive—after they occur.
__________________________________________________________________________________________
AT A GLANCE
Output: Statistical data (no chart plots)
Display: Table format
Timeframes: Sub-daily through monthly
Metrics: 20+ efficiency/pressure indicators
Best for: Volume analysis, quality assessment
__________________________________________________________________________________________
CORE CONCEPT: EFFORT VS RESULT
The fundamental premise is simple:
- Effort = Tick Volume (trading activity)
- Result = Price movement (range, body, net change)
Efficient markets produce substantial price movement with reasonable volume—moves are clean and decisive.
Inefficient markets show high volume but limited net progress—moves are choppy, contested, or absorbed.
By measuring this relationship across individual bars and aggregate periods, you can identify:
- Trending vs. ranging conditions
- Commitment vs. indecision
- Exhaustion vs. continuation
- One-sided vs. two-sided markets
__________________________________________________________________________________________
KEY PARAMETERS CONFIGURATION
These five parameters control what data the indicator displays. Understanding how they work is crucial for effective use.
1. Date Parameter
Purpose: Defines which date/period to analyze.
Format Examples:
""(empty) – Most recent trading day with data"18/12/2025"– Specific date (DD/MM/YYYY)"12/2025"– Entire month (MM/YYYY)"2025"– Entire year (YYYY)
2. TimeRange Parameter
Purpose: Filters which hours to display on sub-daily timeframes.
Applies To: Only sub-daily timeframes (1-minute through 1-hour)
Format Examples:
""(empty) – Full 24-hour trading day"8-16"– 8:00 AM to 4:00 PM"08:00-16:30"– 8:00 AM to 4:30 PM"14"– 2:00 PM to current time
3. WeeksRange Parameter
Purpose: Filters which weeks of the month to display.
Applies To: Only multi-hour timeframes (2-hour through 12-hour)
Format Examples:
""(empty) – All weeks in the month"1"– First week only"1,3"– Weeks 1 and 3"2,3,4"– Weeks 2, 3, and 4
4. MonthsRange Parameter
Purpose: Filters which months of the year to display.
Applies To: Only Weekly timeframes
Format Examples:
""(empty) – All months in the year"1"– January only"1,6,12"– January, June, December"3,4,5,9,10,11"– Q1 (Spring) and Q4 (Fall)
5. MaxDataRows Parameter
Purpose: Limits how many rows (bars) are displayed in the table.
Applies To: All timeframes
Default Value: 24
Format:
-1or0– Show all available data (no limit)- Any positive number – Show that many rows maximum
__________________________________________________________________________________________
FEATURES
Flexibility
- 8 Column Groups: Toggle visibility of Raw Data, Derived, Metrics, Eff Norm, Multipliers, Pressure, Key Observations, Key Metrics
- Multiple Timeframes: Works on sub-daily (1m-1h), multi-hour (2h-12h), daily, weekly, and monthly charts
- Filtering: Time range filter (e.g., "8:00-16:00"), week filter (e.g., "1,3"), month filter (e.g., "1,6,12")
- Max Rows: Limit display to most recent N periods or center around forming bar
- Color Highlighting: Optional gradient highlighting for any column group based on selected metric
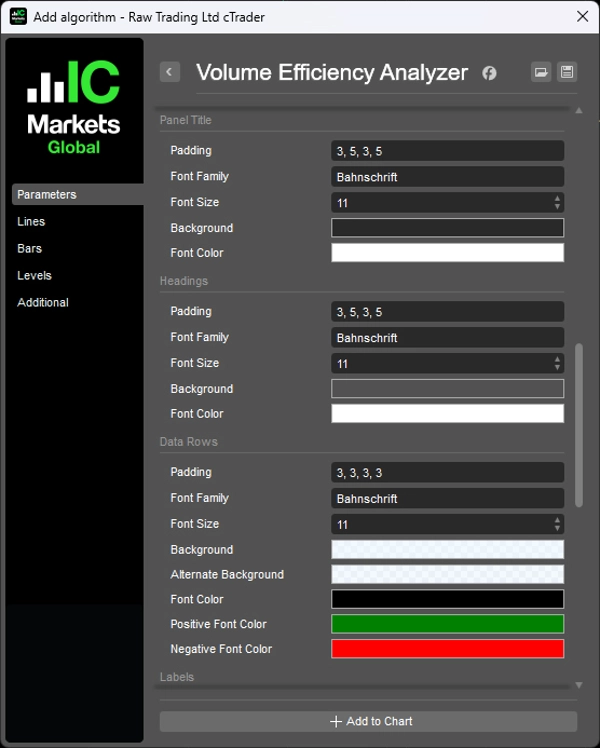
- Customizable Styling: Full control over fonts, colors, padding, column widths
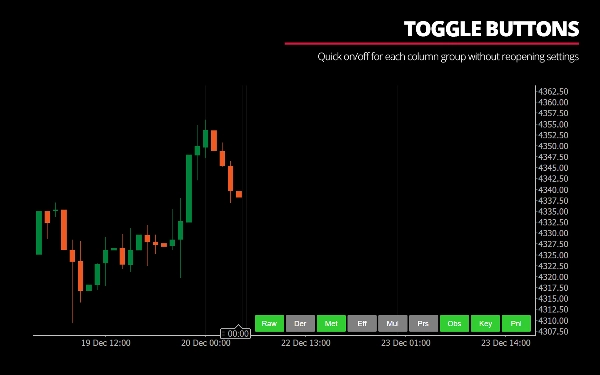
- Toggle Buttons: Quick on/off for each column group without reopening settings
Time Zone Support
- Adjusts for broker server time vs. your local time
- Configurable session start hours (Sydney, Tokyo, Frankfurt, London, NY)
- Hourly trading day start (e.g., 4:00 AM for Asian session traders)
Performance Optimizations
- Binary search for efficient bar lookups
- Single-pass min/max calculations for highlighting
- 500ms throttle on real-time updates to prevent lag
- Search hints to avoid redundant lookups
__________________________________________________________________________________________
UNDERSTANDING THE METRICS
What Makes a Good Move?
- High Efficiency: Traveled far with little volume
- Low Wasted%: Minimal wicks, clean directional bodies
- Aligned Pressure: Buy pressure dominant on bullish closes (or vice versa)
- Strong Conviction: High directional commitment
What Makes a Poor Move?
- Low Efficiency: Required lots of volume to move a little
- High Wasted%: Large wicks, tiny bodies (chop)
- Contradictory Pressure: Bullish close but sell pressure dominated
- Weak Conviction: No directional commitment despite volume
What Does Absorption Mean?
When price struggles to move despite high volume, the market is "absorbing" that volume. This indicates:
- High Absorption: Resistance/support present, hard to move price
- Low Absorption: Easy movement, little opposition
Example Interpretations:
"Strong bullish thrust (buying dominant)"
- High volume + High efficiency + Low waste + Bullish net + Buy pressure dominant
"High volume indecision (potential reversal)"
- High volume + Extreme waste + Tiny body + Balanced pressure
"Bullish close despite bearish pressure"
- Closed up but sell pressure exceeded buy pressure (divergence, potential trap)
"Low participation, no commitment"
- Low volume + Average efficiency + No clear pressure dominance
__________________________________________________________________________________________
ADVANTAGES & BENEFITS
1. Quantifies Intuition
- If you've ever felt "this looks choppy" or "this move seems weak," this indicator quantifies those observations
- Provides objective metrics for subjective assessments
2. Multi-Dimensional Analysis
- Most tools show volume OR price patterns. This shows their relationship
- Combines volume, price structure, directional bias, and pressure dynamics in one view
3. Context-Aware
- Individual bar assessments consider the trend context
- Distinguishes between "consolidation in uptrend" vs. "consolidation in downtrend"
- Flags counter-trend moves that might be traps
4. Educational
- Natural language interpretations help you learn market dynamics
- Over time, you'll start recognizing efficiency patterns without the indicator
5. Versatile Application
- Trend traders: Identify when trends are strong vs. exhausting
- Range traders: Spot high-waste consolidation zones
- Breakout traders: Detect high-volume decisive breaks vs. false breaks
- Volume traders: See volume in context of what it achieved
6. No Lag
- All calculations are based on completed bars (or current forming bar)
- No smoothing, no moving averages, no repainting
__________________________________________________________________________________________
CHALLENGES AND CONCERNS
Before using this indicator, understand these important considerations:
This Indicator is NOT For Everyone:
1. High Complexity
- 20+ metrics across 8 column groups
- Requires understanding of volume analysis, price action, and market microstructure
- Learning curve is steep—expect 1-2 weeks of observation before patterns become clear
2. Information Overload
- Default "show everything" view is overwhelming
- You must customize it to match your trading focus
- Decision paralysis is possible if you try to use all metrics at once
3. Not a Trading System
- This indicator does NOT tell you when to buy or sell
- It tells you what the market is doing, not what YOU should do
- You must integrate it with your own entry/exit rules
4. Interpretation Required
- "High volume indecision" could mean pre-breakout OR exhaustion
- "Efficient bullish move" doesn't guarantee continuation
- You need market context beyond what the indicator shows
5. Volume Limitations
- Forex uses tick volume (transaction count), not real volume
- Low-liquidity instruments may show erratic efficiency readings
- News events can create volume spikes that skew metrics temporarily
6. Performance on Lower Timeframes
- On 1-minute charts with 100+ visible bars, UI may feel sluggish
- More bars = more calculations per update
- Recommended: Use ≥5-minute charts for real-time monitoring
7. No Alerts
- Currently does not generate alerts for specific conditions
- You must monitor the display manually
8. Subjective Thresholds
- "High" volume is defined as 1.25x average—this is my personal threshold
- "Extreme" waste is ≥80%—also subjective
- You may disagree with these definitions, but they're hardcoded
__________________________________________________________________________________________
HOW IT WORKS
1. Data Collection
- Define the analysis period (date/time range)
- For each bar in the period, collect OHLCV data from the chart's bars
- Calculate derived and efficiency metrics for each bar
- Aggregate metrics to establish averages and extremes
2. Interpretation Logic
The natural language assessments follow a priority-based decision matrix:
Priority 1: Indecision Patterns
- Extreme wasted % (≥80%) or tiny body with high wicks → Doji/Rejection signals
- High volume + extreme waste → Potential exhaustion
Priority 2: High Volume Scenarios
- High volume + high efficiency + low waste → Decisive thrust
- High volume + high efficiency + high waste → Breakout with resistance
- High volume + low efficiency + high waste → Absorption/contested move
Priority 3: Efficiency-Driven Signals
- High efficiency regardless of volume → Clean/efficient moves
- Low efficiency → Drift, grind, or weak moves
Priority 4: Volume Level Fallbacks
- Low volume → Drift, no commitment
- Average volume → Assessed by conviction, body %, waste level
3. Refinements:
- Pressure analysis detects contradictions (e.g., "bullish close but selling pressure dominated")
- Wick analysis identifies rejection (upper wicks on bullish bars = sellers defended highs)
- Trend context adds "[with trend]" or "[counter-trend]" markers
4. Summary Calculation
- Count bullish vs. bearish bars
- Calculate directional efficiency (bull moves vs. bear moves)
- Measure absorption ratios (how much resistance each side faced)
- Compute cumulative net movement and trend context
- Generate unified bias that combines count, magnitude, and trend direction
__________________________________________________________________________________________
TECHNICAL NOTES
Calculation Method
- Uses cumulative bar analysis within each period
- Sums all sub-bars' volume, wicks, bodies
- Calculates net directional bias from cumulative data
- More accurate than simple OHLC analysis
Normalization
- Efficiency normalized relative to min/max in visible dataset
- Ensures ratings are contextually appropriate
- Ratings scale: Extreme (80-100%) → High (60-80%) → Mid (40-60%) → Low (20-40%) → Lowest (0-20%)
Trend Context
- Calculates cumulative net pips over all preceding periods
- Identifies consecutive directional periods
- Compares recent vs prior efficiency and pressure
- Labels: "Uptrend (strong)", "Downtrend (weak)", "Ranging"
__________________________________________________________________________________________
FINAL NOTE
This indicator was built with the belief that understanding market quality is more valuable than predicting direction.
Instead of asking "will price go up?", it asks:
- "Is this move high quality?"
- "Are buyers/sellers struggling or efficient?"
- "Is this breakout sustainable or weak?"
- "Are current dynamics aligned or diverging?"
By focusing on quality over prediction, traders can:
- Avoid low-probability setups
- Enter moves with commitment behind them
- Exit when effort exceeds result
- Understand when to stay out (poor quality environment)
If you value transparency, education, and understanding why price moves the way it does, this indicator may be valuable to you.
If you prefer simplicity and quick signals, other tools will serve you better.
__________________________________________________________________________________________
MORE FREE INDICATORS
Explore a wide range of market analysis tools—from structure and volume to regression, volatility, and custom timeframes.
Source code is available on GitHub repository.
All free to use. But if you feel like sending coffee support, you can route it here.
Support/Resistance
Volume
- Volume Activity Profiler
- Volume Efficiency Analyzer
- Volume Profile Analytics
- Volume Profile - Updated
- Volume Spread Analysis
- VWAP (Volume Weighted Average Price)
Moving Averages
- SSL Channel
- Anchored Moving Average
- Deviation-Scaled Moving Average
- Gann High Low Activator
- Instantaneous Trendline
- Kaufman Adaptive MA with Trend Vision
- Moving Average Channel
- Moving Averages Suite
- Trend Channel Moving Average
Utilities/Custom
Regression-Based
Volatility
Oscillators
__________________________________________________________________________________________
DISCLAIMER
Trading involves risk. This indicator is intended for technical analysis only — always apply proper risk management and trade responsibly.
FEECBACK & IMPROVEMENTS
If you have suggestions, feature requests, or ideas for enhancement, please leave a comment in the Discussion tab. Your feedback helps improve the indicator for everyone.
요약
Key features include customizable column groups, color highlighting, and time zone adjustments for various trading sessions. The indicator quantifies market conditions by identifying efficient versus inefficient moves, absorption levels, and directional pressure, helping traders distinguish between decisive, exhausted, or indecisive price actions after they occur. It incorporates trend context and natural language interpretations to aid understanding of market dynamics.
Volume Efficiency Analyzer does not generate buy/sell signals or alerts; it is intended to complement traders’ own strategies by providing objective metrics that quantify market quality rather than predict direction. It requires familiarity with volume analysis and market microstructure due to its complexity and information density. The indicator is suitable for trend, range, breakout, and volume-focused traders seeking a comprehensive, multi-dimensional view of market behavior.
고객 리뷰
5 | 100 % | |
4 | 0 % | |
3 | 0 % | |
2 | 0 % | |
1 | 0 % |
상담
자주 묻는 질문(FAQ)
이 작성자의 상품 더 보기













!["Gaussian Channel [Iridio Capital]" 로고](https://cdn.ctrader.com/image/webp/2c4f9ca9-4e9b-476d-b5a6-787c8095032b_61546)








가격