Descrição
VISÃO GERAL
O indicador Waddah Attar Explosion (WAE) foi criado por Ahmad Waddah Attar e apresentado à comunidade de traders em 2007. Ele combina a medição de momentum do MACD com a análise de volatilidade das Bandas de Bollinger para identificar momentos de "explosão de preço" — períodos em que o preço passa de consolidação para um movimento direcional forte.
O indicador responde a duas perguntas:
- O momentum está se acumulando? (medido pela taxa de variação do MACD)
- A volatilidade está aumentando? (medido pela largura das Bandas de Bollinger)
Quando ambas as condições se alinham acima de um filtro de ruído (Zona Morta), isso sinaliza um possível movimento explosivo.
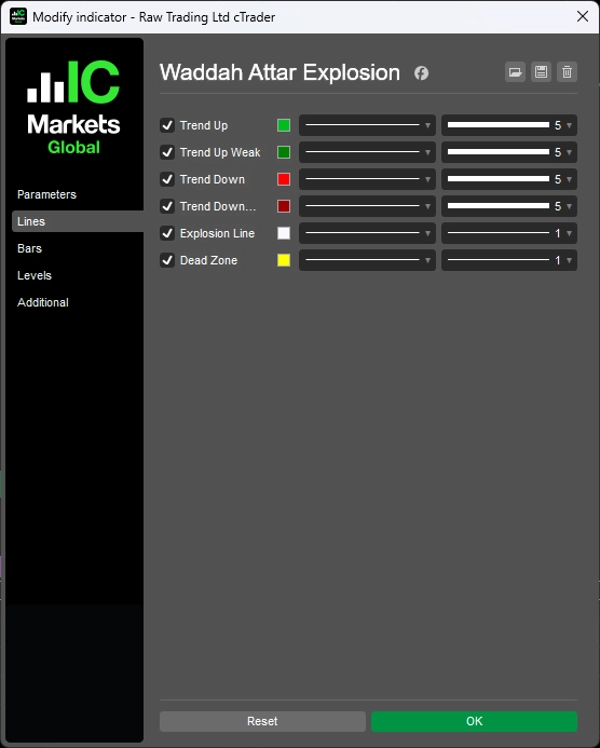
COMPONENTES
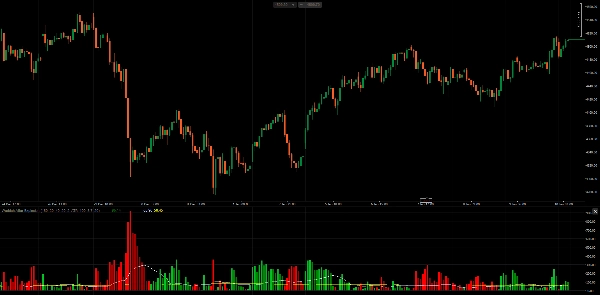
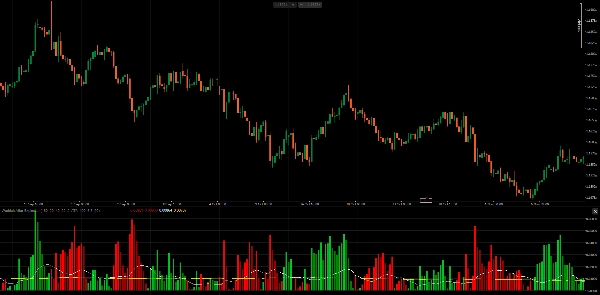
1. Histograma de Tendência (Verde/Vermelho) Exibe a taxa de variação da linha MACD, multiplicada por um fator de sensibilidade.
- Cálculo:
(MACD_atual - MACD_anterior) × Sensibilidade - Barras verdes: Momentum de alta (MACD acelerando para cima)
- Barras vermelhas: Momentum de baixa (MACD acelerando para baixo)
- Cor clara: Momentum aumentando em comparação com a barra anterior
- Cor escura: Momentum diminuindo em comparação com a barra anterior
2. Linha de Explosão (Branca) Representa a largura das Bandas de Bollinger, indicando expansão ou contração da volatilidade.
- Cálculo:
BB_Superior - BB_Inferior - Subindo: Volatilidade aumentando (possível rompimento)
- Descendo: Volatilidade contraindo (consolidação)
3. Zona Morta (Amarela) Um filtro de limiar para eliminar sinais fracos causados pelo ruído do mercado.
- Baseado em ATR: Adapta-se à volatilidade atual do mercado
- Pips Fixos: Valor de limiar estático
COMO AHMAD WADDAH ATTAR USA
De acordo com o autor original:
Regras de Entrada para Compra Todas as condições devem ser atendidas:
- Histograma verde está subindo
- Histograma verde está acima da Linha de Explosão
- Linha de Explosão está subindo
- Tanto o histograma verde quanto a Linha de Explosão estão acima da Zona Morta
Regras de Entrada para Venda Todas as condições devem ser atendidas:
- Histograma vermelho está subindo
- Histograma vermelho está acima da Linha de Explosão
- Linha de Explosão está subindo
- Tanto o histograma vermelho quanto a Linha de Explosão estão acima da Zona Morta
Regras de Saída
- Saia da posição longa quando o histograma verde cruzar para baixo da Linha de Explosão
- Saia da posição curta quando o histograma vermelho cruzar para baixo da Linha de Explosão
Insight Principal O ângulo da Linha de Explosão é importante. Quando a Linha de Explosão está inclinada para cima e o histograma rompe acima dela, isso confirma que a volatilidade está aumentando ativamente — a "explosão" é real, não um sinal falso.
PARÂMETROS
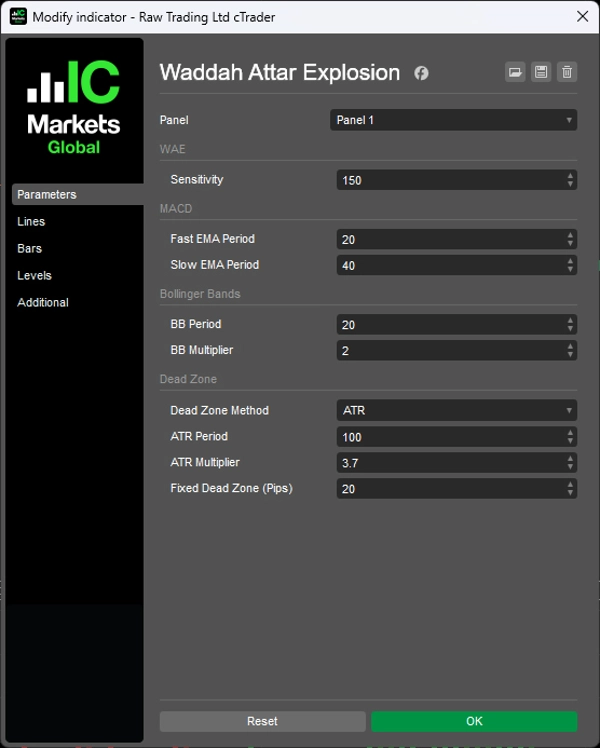
1. Sensibilidade
- Sensibilidade (150): Multiplicador para a taxa de variação do MACD
2. MACD
- Período EMA Rápida (20): Média móvel rápida para cálculo do MACD
- Período EMA Lenta (40): Média móvel lenta para cálculo do MACD
3. Bandas de Bollinger
- Período BB (20): Período de retrocesso das Bandas de Bollinger
- Multiplicador BB (2.0): Multiplicador do desvio padrão
4. Zona Morta
- Método da Zona Morta (ATR): Escolha entre baseado em ATR ou Pips Fixos
- Período ATR (100): Período para cálculo do ATR
- Multiplicador ATR (3.7): Multiplicador aplicado ao ATR para a Zona Morta
- Zona Morta Fixa (20): Valor da Zona Morta em pips (quando usa o método fixo)
NOTAS
- O indicador funciona em todos os intervalos de tempo. O autor original recomendou H1 e M30.
- A Zona Morta baseada em ATR é recomendada pois se adapta a diferentes instrumentos e condições de mercado.
- O parâmetro Sensibilidade pode precisar de ajuste baseado no intervalo de tempo e volatilidade do instrumento.
- Este indicador identifica o alinhamento de momentum e volatilidade — não prevê a direção por si só. Considere usá-lo junto com análise de tendência ou níveis de suporte/resistência.
__________________________________________________________________________________________
MAIS INDICADORES GRATUITOS
Explore uma ampla gama de ferramentas de análise de mercado — desde estrutura e volume até regressão, volatilidade e intervalos de tempo personalizados.
O código-fonte está disponível no repositório do GitHub repository.
Todos gratuitos para usar. Mas se quiser enviar um apoio para café, você pode fazer isso aqui.
Suporte/Resistência
Volume
- Perfilador de Atividade de Volume
- Analisador de Eficiência de Volume
- Análise de Perfil de Volume
- Perfil de Volume - Atualizado
- Análise de Spread de Volume
- VWAP (Preço Médio Ponderado por Volume)
Médias Móveis
- Canal SSL
- Média Móvel Ancorada
- Média Móvel Escalonada por Desvio
- Ativador Gann High Low
- Linha de Tendência Instantânea
- Média Móvel Adaptativa Kaufman com Visão de Tendência
- Canal de Média Móvel
- Conjunto de Médias Móveis
- Média Móvel de Canal de Tendência
Utilitários/Personalizados
- Ferramentas de Gráfico
- Intervalos de Tempo Personalizados
- Candlestick de Intervalo de Tempo Superior
Baseado em Regressão
Volatilidade
Osciladores
__________________________________________________________________________________________
ISENÇÃO DE RESPONSABILIDADE
Negociar envolve riscos. Este indicador é destinado apenas para análise técnica — sempre aplique uma gestão de risco adequada e negocie com responsabilidade.
FEEDBACK E MELHORIAS
Se você tiver sugestões, pedidos de recursos ou ideias para melhorias, por favor deixe um comentário na aba Discussão. Seu feedback ajuda a melhorar o indicador para todos.