Penerangan
Penunjuk Kedai Pinescriptlabs: 🤖Pinescriptlabs Kedai cBots : (cBot) Gold & BTC BreakoutSession Pivots(baru)
Ramalan Berdasarkan Linreg & ATR
Sokongan SmartTrend &
Rintangan
Garis
Dinamik
Struktur Pasaran
Analisis
daripada
Titik
Pusingan
Fibonacci
Regresi
Linear
Berbilang jangka masa
Berbilang Tahap
Bias Lilin
Penjejak
Auto
Sokongan dan
Rintangan
Tren
Garis
Semua
Sokongan dan
Rintangan
Tahap
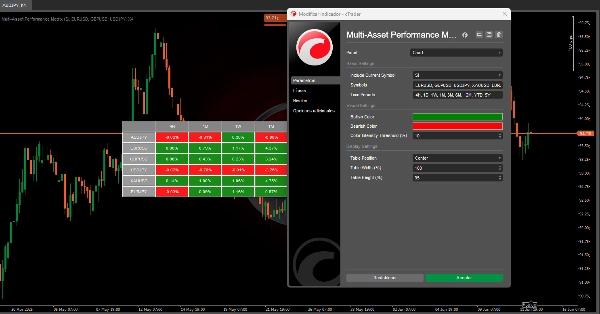
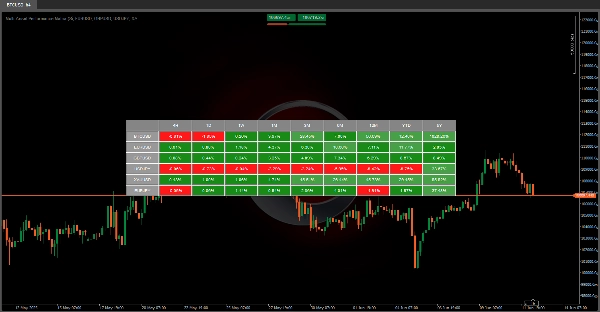
🚀 MATRIKS PRESTASI MULTI ASET 🚀
Algoritma ini adalah alat visual yang kuat 📊 direka untuk memaparkan peratusan prestasi pelbagai instrumen kewangan merentasi tempoh masa yang berbeza.
Ia mengubah data sejarah menjadi visualisasi yang cekap dan intuitif, membolehkan pengguna menilai dengan cepat tingkah laku pelbagai aset kewangan.
❓ Apa Fungsi Alat Ini?
1️⃣ 📈 Membandingkan Aset: Menunjukkan bagaimana harga pelbagai instrumen kewangan (seperti BTCUSD, EURUSD, XAUUSD, dan lain-lain) telah berubah dari masa ke masa.
- Jangka masa: D (Harian) | 1M (Mingguan) | 1B (Bulanan) | 3B (Suku Tahunan) | 6B (Separuh Tahun) | 12B (Tahunan) | YTD (Tahun ke Tarikh) | 5T (5 Tahun Terakhir)
2️⃣ 🎨 Menonjolkan Tren: Menggunakan kod warna (🟢, 🔴 ) untuk mengenal pasti dengan segera aset mana yang meningkat atau menurun dalam setiap tempoh.
3️⃣ ⏱️ Kemas Kini Automatik: Menyegarkan data setiap minit untuk mencerminkan maklumat pasaran terkini.
💡 Kenapa Ini Berguna?
✔ 📊 Analisis Perbandingan: Membolehkan perbandingan sebelah-menyebelah pelbagai aset—sesuai untuk pengurusan portfolio atau memilih aset berprestasi terbaik berdasarkan jangka masa.
✔ 🛡️ Kawalan: Menilai konsistensi (atau volatiliti) aset merentasi tempoh berbeza membantu menilai risiko yang berkaitan.
✨ Utama
✅ ⏳ Menjimatkan Masa: Mengumpul dan mengira data ini secara manual akan mengambil masa berjam-jam—alat ini melakukannya dengan serta-merta!
✅ 👀 Jelas Secara Visual: Sistem berkod warna memudahkan analisis, walaupun untuk pengguna bukan teknikal.
✅ 🔄 Boleh Disesuaikan: Menyokong simbol tersuai, jadi anda boleh menjejaki aset yang penting bagi anda.
Ringkasan
Ulasan pelanggan
5 | 100 % | |
4 | 0 % | |
3 | 0 % | |
2 | 0 % | |
1 | 0 % |


![Logo "[Stellar Strategies] Wave Trend Pro"](https://cdn.ctrader.com/image/webp/5f226fbb-245a-41cd-9cdd-b018257d5e6d_28617)