
Penerangan
Penunjuk ini berdasarkan pada menganalisis tindakan harga 📈 untuk mengenal pasti perubahan dalam struktur pasaran dan kawasan utama yang menarik. Berikut adalah ringkasan terperinci tentang cara ia berfungsi:
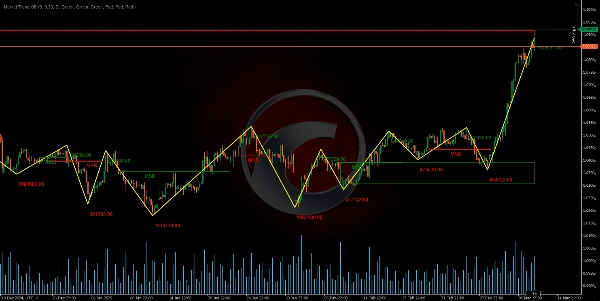
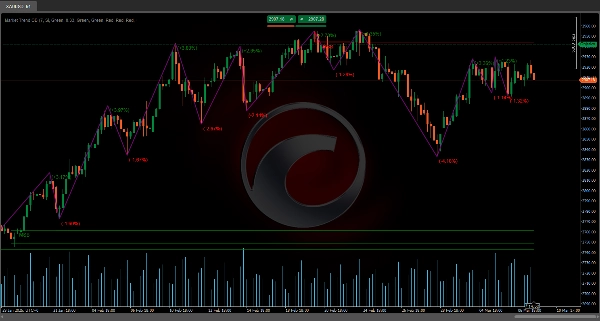
Pengesanan Pivots dan Pembentukan Zigzag 🔄
Satu tempoh tertentu (ditakrifkan oleh parameter panjang) dianalisis untuk mengenal pasti tinggi dan rendah relatif. Dengan membandingkan harga dalam selang itu, titik pivot (titik infleksi) dikesan, yang seterusnya membentuk corak zigzag ⚡. Corak ini membantu membezakan bila pembalikan harga berlaku.
Pengumpulan Isipadu dan Pengiraan Penyimpangan 📊
Semasa proses pengesanan pivot, isipadu tick dikumpulkan dalam segmen yang dinilai. Selain itu, perbezaan peratusan antara harga pivot dikira untuk menentukan sama ada pergerakan itu cukup signifikan. Penyimpangan ini dibandingkan dengan ambang yang ditetapkan, yang membantu mengesahkan bahawa perubahan dalam struktur adalah benar ✅.
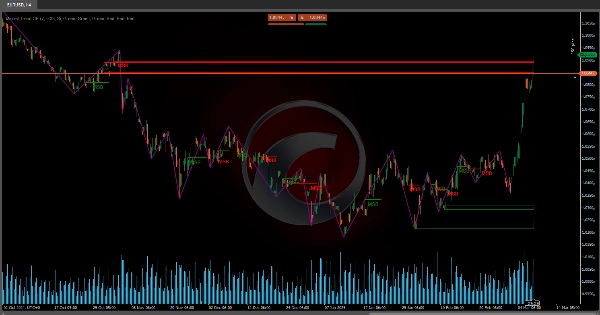
Definisi Pecahan Struktur Pasaran (MSB) 🚨
Penunjuk menilai dua pivot terakhir (sama ada tinggi atau rendah) dan, dengan menggunakan faktor retracement (diilhamkan oleh tahap Fibonacci), menentukan sama ada pecahan dalam struktur telah berlaku.
- Jika, selepas memecahkan tinggi lama, harga mula menghasilkan rendah yang lebih rendah, peralihan kepada struktur menurun diiktiraf 🐻.
- Begitu juga, jika selepas memecahkan rendah lama, harga menghasilkan tinggi yang lebih tinggi, peralihan kepada struktur menaik dianggap 🐂.
Perubahan ini ditafsirkan sebagai Pecahan Struktur Pasaran (MSB).
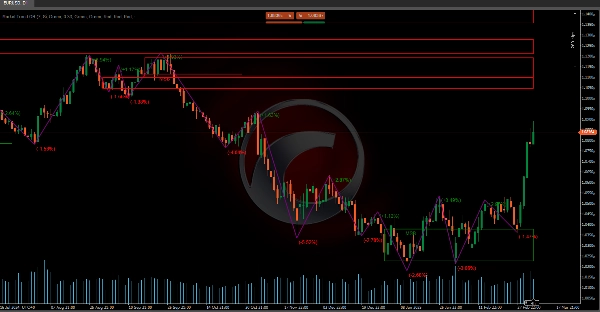
Pengenalpastian Blok Pesanan dan Kotak Pecahan 📦
Setelah MSB dikesan, zon kritikal ditakrifkan berdasarkan tindakan harga sebelumnya:
- Blok Pesanan (OB) 🧱: Ini dikenalpasti sebagai zon di mana tindakan penting terakhir berlaku sebelum pecahan. Dalam struktur menurun, lilin menaik terakhir sebelum tinggi baru diambil; dalam struktur menaik, lilin menurun terakhir sebelum rendah baru digunakan.
- Kotak Pecahan (BB) 📈: Ini ditentukan dengan cara yang sama tetapi mengambil kira julat tambahan untuk mengesahkan bahawa harga telah memecahkan tahap sebelumnya.
Zon-zon ini membantu menentukan kawasan di mana aktiviti tertumpu dan mungkin bertindak sebagai sokongan atau rintangan pada masa depan.
Visualisasi Data Zigzag yang Berkaitan 📊
Selain memplot urutan pivot, penunjuk ini menggabungkan data tambahan:
- Harga Pembalikan 💹: Nilai tepat di mana perubahan trend dikesan direkodkan.
- Perubahan Peratusan Pembalikan 🔄: Variasi peratusan antara harga pivot baru dan sebelumnya dikira, menunjukkan magnitud perubahan.
- Isipadu Terkumpul 📉: Jumlah isipadu tick semasa segmen yang membawa kepada pembentukan pivot dipaparkan.
Data ini membolehkan penilaian kekuatan dan kepentingan pergerakan tanpa bergantung pada andaian, kerana ia berdasarkan pengiraan konkrit.
Secara ringkas, alat ini menganalisis tindakan harga untuk mengesan bila pasaran mengubah trend (MSB) dan mentakrifkan zon (blok pesanan dan kotak pecahan) yang boleh menjadi kunci untuk keputusan perdagangan 💼. Integrasi corak zigzag dengan analisis isipadu dan penyimpangan peratusan memberikan pandangan menyeluruh tentang struktur pasaran, menawarkan maklumat tepat mengenai titik pembalikan dan kekuatan pergerakan 💪.
Penunjuk Kedai Ctrader:
Struktur Pasaran Dinamik
Analisis Titik Pusing
Fibonacci Linear
Regresi Multi-masa
Bias Lilin Pelbagai Tahap
Penjejak
Garis Trend Sokongan dan
Rintangan Auto
Ringkasan
It defines Market Structure Breaks (MSB) by evaluating recent pivots with a retracement factor inspired by Fibonacci levels. A break in structure is signaled when price action shifts from higher highs to lower lows (bearish) or from lower lows to higher highs (bullish).
Upon detecting an MSB, the indicator identifies critical zones: Order Blocks (OB), representing the last significant candle before a breakout, and Breakout Boxes (BB), which confirm price level breaches with an additional range. These zones serve as potential future support or resistance areas.
The tool visualizes relevant zigzag data, including reversal prices, percentage changes, and accumulated volume, enabling assessment of movement strength and relevance based on concrete calculations. This comprehensive approach integrates zigzag patterns, volume analysis, and deviation metrics to provide precise information on reversal points and market movement strength, supporting informed trading decisions.
Ulasan pelanggan
5 | 100 % | |
4 | 0 % | |
3 | 0 % | |
2 | 0 % | |
1 | 0 % |


