Opis
Wskaźniki Pinescriptlabs Store: Pinescriptlabs Store cBoty : (cBot) Gold & BTC BreakoutSession Pivots(nowy)
Prognoza oparta na Linreg & ATR
SmartTrend Wsparcie &
Opór
Linie
Dynamiczna
Struktura Rynku
Analiza
Punktów
Zwrotnych
Punktów
Fibonacci
Regresja
Liniowa
Wieloczasowa
Momentum Luka Wartości Rynkowej
Wielopoziomowy
Śledzenie Kierunku Świec
Tracker
Automatyczne
Wsparcie i
Opór
Trend
Linie
Wszystkie
Poziomy Wsparcia i
Opór
Poziomy
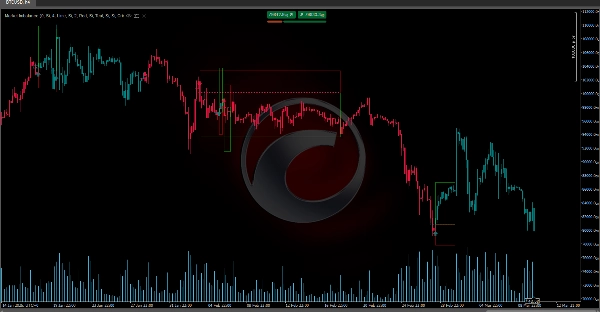
MarketImbalanceDetector identyfikuje nierównowagi rynkowe i wizualnie zaznacza kluczowe obszary na podstawie wzorców cenowych i zmienności (ATR). Oto proste wyjaśnienie, jak to działa:
🔍 Wykrywanie sygnałów
Porównuje ceny poprzednich świec, aby wykryć wzorce bycze lub niedźwiedzie. Używając określonych warunków (takich jak porównanie minimów i maksimów poprzednich świec) oraz filtrując sygnały za pomocą bieżącej zmienności, zapewnia, że ruch jest istotny.
📊 Wizualizacja nierównowag
Gdy sygnał zostanie zidentyfikowany, wskaźnik rysuje na wykresie:
- Obszar Nierównowagi (prostokąt) oznaczający strefę, w której wystąpił wzorzec.
- Średnia Linia Poziomu (obliczona na podstawie odpowiednich maksimów i minimów) pomagająca wizualizować wsparcie lub opór.
- Ikona (strzałka) wskazująca kierunek sygnału (⬆️ dla byczego, ⬇️ dla niedźwiedziego).
Strefy OP/PE
Dodatkowo tworzy strefy zwane OP () i PE (Punkt Ucieczki). Te strefy są obliczane przez dodanie lub odjęcie wielokrotności ATR od średniego poziomu, pomagając określić obszary do realizacji zysków lub ograniczenia strat.
Podsumowanie
When a signal is detected, the indicator visually marks the chart with:
- An Imbalance Area (a rectangle) highlighting the zone where the pattern occurred.
- An Average Level Line calculated from relevant highs and lows to indicate potential support or resistance.
- An Icon (arrow) showing the signal direction: upward for bullish and downward for bearish.
Additionally, the indicator calculates OP (Order Point) and PE (Escape Point) zones by adding or subtracting multiples of ATR to the average level. These zones assist traders in defining areas for taking profit or cutting losses.
This tool supports analysis across various markets including cryptocurrencies (e.g., BTCUSD), commodities (e.g., XAUUSD), and integrates concepts related to breakout strategies, trend indicators like Supertrend, and momentum measures such as RSI. It is intended to enhance market structure understanding and assist in decision-making by visually representing key imbalance zones on trading charts.