
Descrição
VERSÃO ATUALIZADA DISPONÍVEL AQUI
Procurando mais do que apenas sobreposições de períodos nativos? O indicador Custom Timeframes estende esse conceito com adições poderosas:
- Períodos não padrão (5H, 7H, 9H-23H, 25m, 35m, 50m, 55m, 4 dias, 2 semanas, 3 semanas, multi-mensal, multi-anual)
- Linhas OHLC com controle de deslocamento de barra para barras completas ou em formação
- Sete níveis de Fibonacci (11,4% a 88,6%) com destaque para zona de equilíbrio
- Médias móveis calculadas diretamente na estrutura de período personalizado (9 tipos de MA, 8 fontes de preço)
- Botões de alternância para gerenciamento rápido de recursos.
Se você precisa de períodos entre os intervalos padrão do gráfico com sobreposição completa de análise técnica, confira a versão atualizada.
__________________________________________________________________________________________
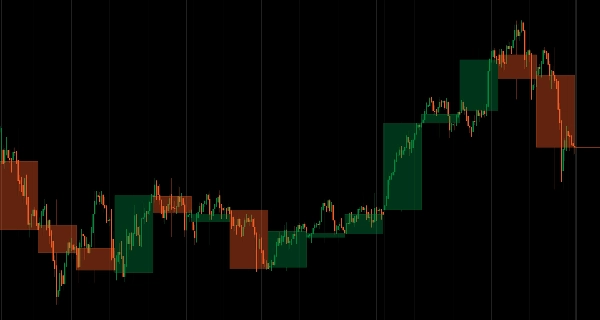
Sobreponha velas HTF em tempo real em qualquer gráfico sem trocar de períodos.
Exibe a estrutura da vela de período superior (corpo e pavios) diretamente em gráficos de período inferior com atualizações ao vivo conforme o período avança.
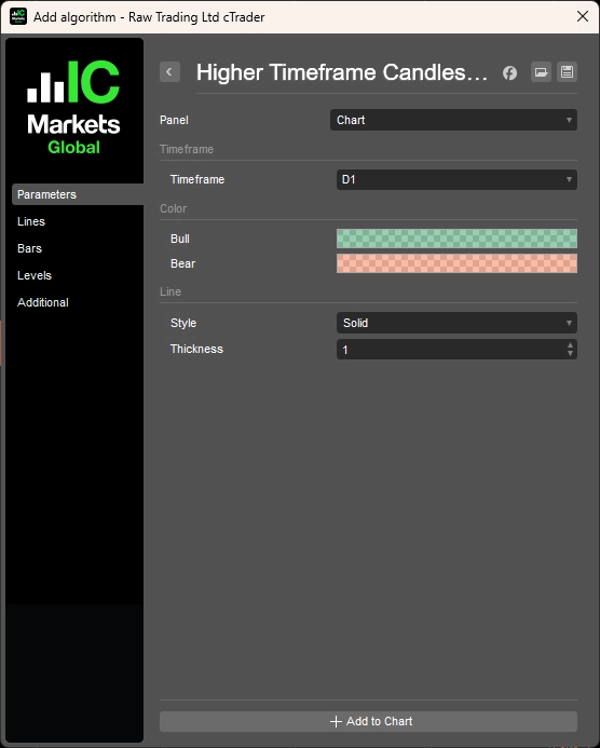
Seleção flexível de períodos (Diário no H1, Semanal no H4, Mensal no Diário), viés de alta/baixa codificado por cores (verde/vermelho), estilo de linha e transparência personalizáveis, e desempenho leve fornecem contexto contínuo de HTF para traders que monitoram a estrutura em múltiplos períodos sem trocar de gráfico.
RECURSOS
Seleção Flexível de Período
- Qualquer HTF: Diário no H1, Semanal no H4, Mensal no Diário—sua escolha
- Atualizações em tempo real: vela HTF redesenha conforme o período avança
- Sempre visível: negocie períodos inferiores mantendo o contexto do período superior
Clareza Visual
- Codificado por cores: Alta (verde), Baixa (vermelho)—confirmação instantânea do viés
- Personalizável: estilo da linha, espessura, transparência
- Apresentação limpa: corpo e pavios claramente exibidos
Integração Simples
- Não é necessário trocar de período
- Mantém o contexto do gráfico enquanto mostra a estrutura HTF
- Leve e otimizado para desempenho
__________________________________________________________________________________________
MAIS INDICADORES GRATUITOS
Explore uma ampla gama de ferramentas de análise de mercado—desde estrutura e volume até regressão, volatilidade e períodos personalizados.
O código-fonte está disponível no repositório do GitHub repository.
Todos gratuitos para usar. Mas se quiser enviar um suporte para café, você pode fazer isso aqui.
Suporte/Resistência
Volume
- Volume Activity Profiler
- Volume Efficiency Analyzer
- Volume Profile Analytics
- Volume Profile - Updated
- Volume Spread Analysis
- VWAP (Volume Weighted Average Price)
Médias Móveis
- Anchored Moving Average
- Deviation-Scaled Moving Average
- Instantaneous Trendline
- Kaufman Adaptive MA with Trend Vision
- Moving Average Channel
- Moving Averages Suite
- Trend Channel Moving Average
Utilitários/Personalizados
Baseado em Regressão
Volatilidade
Osciladores
__________________________________________________________________________________________
AVISO LEGAL
Negociar envolve riscos. Este indicador é destinado apenas para análise técnica — sempre aplique gerenciamento de risco adequado e negocie com responsabilidade.
FEEDBACK E MELHORIAS
Se você tiver sugestões, pedidos de recursos ou ideias para aprimoramento, por favor deixe um comentário na aba Discussão. Seu feedback ajuda a melhorar o indicador para todos.


