
Descrição
Pinescritlabs
Indicadores da Ctrader Store: 🤖cBots da Pinescritlabs Ctrader Store:
Fair Value Gap Sessions Gold & BTC Breakout Session Pivots(novo)
Estrutura Dinâmica do Mercado
Análise de Pontos de Virada
Fibonacci Linear
Regressão Multi-temporal
Gradiente de Tendência Dinâmico
Viés de Vela Multi-Nível
Rastreador
Rastreador de Extremos Zig-Zag
Linhas de Tendência de Suporte e
Resistência Automáticas
Todos os Níveis de Suporte e
Resistência
Mapa de Liquidação de Alavancagem
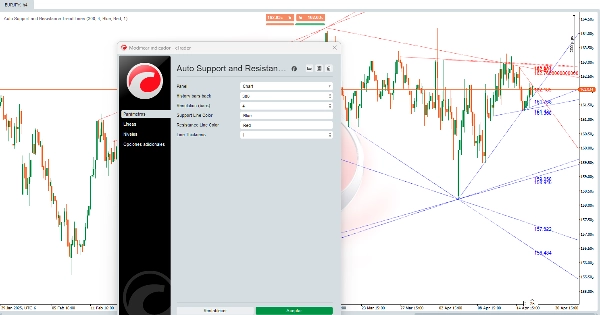
Linhas de Tendência de Suporte e Resistência Automáticas:
Este algoritmo é uma ferramenta poderosa 🛠️ projetada para identificar automaticamente níveis de suporte e resistência em um gráfico de preços. Ele não apenas desenha linhas horizontais, mas também traça canais diagonais ↗️↘️ que representam tendências de mercado. Esses níveis e canais são áreas-chave onde o preço teve dificuldade para subir (resistência 🚧) ou cair (suporte 🛡️), tornando-os pontos cruciais para decisões de negociação. 📈📉
Como São Feitos os Cálculos? 🔍
O algoritmo utiliza uma abordagem de análise do histórico de preços 📊 para identificar níveis de suporte e resistência. Veja como funciona:
- Identificação de Mínimos e Máximos Locais ⬇️⬆️
-
- O algoritmo analisa o preço em um intervalo específico de barras (velas) para encontrar mínimos locais (os preços mais baixos nesse intervalo) e máximos locais (os preços mais altos nesse intervalo).
- Esses mínimos e máximos locais são candidatos potenciais para se tornarem níveis de suporte e resistência.
- Validação dos Níveis ✔️
-
- Uma vez identificados os mínimos e máximos locais, o algoritmo verifica se esses níveis foram respeitados pelo preço no passado.
- Se o preço tocou um nível várias vezes sem rompê-lo claramente, ele é considerado um nível válido de suporte ou resistência.
- Desenho de Linhas e Canais ✏️
-
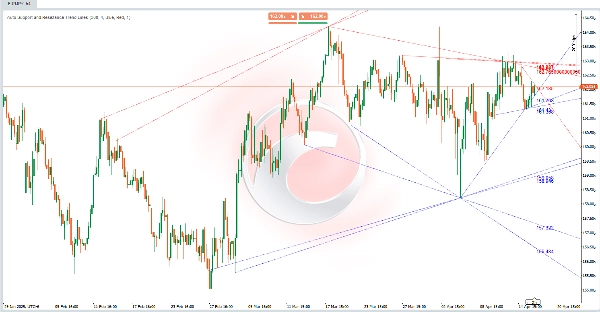
- Os níveis de suporte são desenhados como linhas horizontais (ou diagonais) nos mínimos locais validados.
- Os níveis de resistência são desenhados como linhas horizontais (ou diagonais) nos máximos locais validados.
- Além disso, o algoritmo conecta esses níveis para formar canais diagonais ↗️↘️, que representam tendências de alta ou baixa no mercado.
- Atualizações Dinâmicas 🔄
-
- O indicador atualiza automaticamente a cada nova barra, recalculando e redesenhando os níveis de suporte e resistência com base no comportamento mais recente do preço.
Como Este Algoritmo Ajuda os Traders? 💡
Este algoritmo é um divisor de águas para os traders porque:
- Fornece uma Visão Macro do Mercado 🌐
-
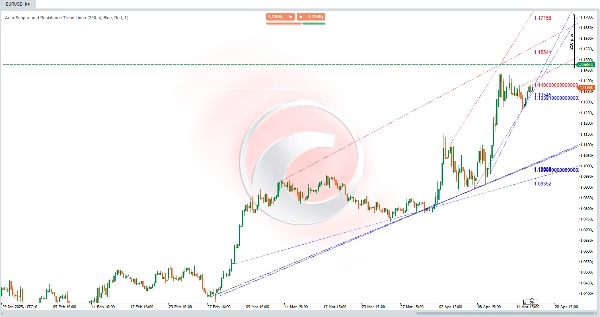
- Ao desenhar canais diagonais, o algoritmo mostra as principais tendências do mercado, ajudando os traders a identificar se o preço está em uma tendência de alta 📈, tendência de baixa 📉, ou movimento lateral ↔️.
- Identifica Áreas-Chave de Suporte e Resistência 🎯
-
- Os níveis de suporte e resistência são zonas onde o preço pode recuar ou romper. Esses níveis são úteis para:
-
- Definir pontos de entrada e saída para negociações.
- Colocar ordens de stop-loss 🛑 e take-profit ✅.
- Identificar rupturas 🚀 ou reversões 🔄 no preço.
- Simplifica a Análise Técnica 🕒
-
- O algoritmo automatiza o processo de identificação de suporte e resistência, economizando tempo para os traders que realizam análises manuais.
- Ao exibir claramente níveis e canais, ajuda os traders a tomar decisões mais informadas.
- Personalizável 🎨
-
- Os traders podem ajustar parâmetros como o número de barras históricas analisadas, espessura da linha, e cores, permitindo que o indicador seja adaptado a diferentes estilos de negociação e preferências visuais.
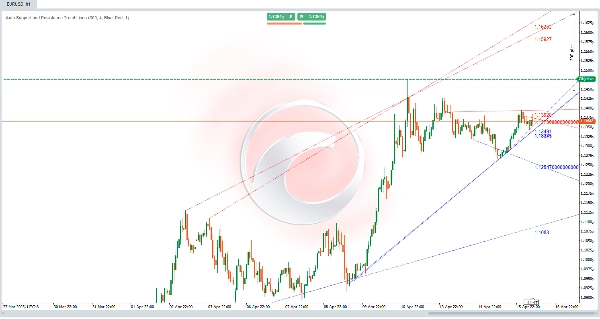
Exemplo Prático 📌
Imagine que você está analisando um gráfico de preços, e o algoritmo desenhou:
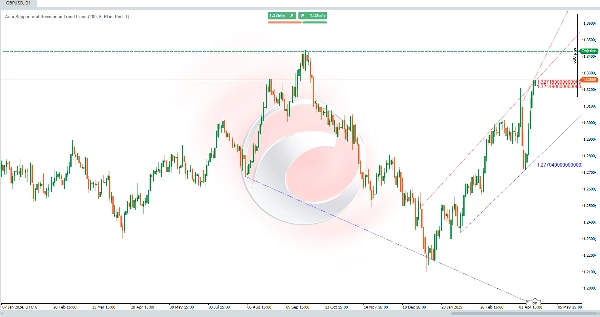
- Uma linha de suporte diagonal ↗️ conectando vários mínimos locais, indicando uma tendência de alta.
- Uma linha de resistência diagonal ↗️ conectando vários máximos locais, mostrando um canal ascendente.
- Várias linhas horizontais representando níveis-chave de suporte e resistência.
Com essas informações, você pode:
- Identificar que o preço está em uma tendência de alta 📈.
- Procurar oportunidades de compra perto da linha de suporte diagonal ou dos níveis de suporte horizontais.
- Definir um stop-loss 🛑 abaixo do nível de suporte mais próximo.
- Observar se o preço rompe a resistência para confirmar a continuação da tendência ou uma possível reversão 🔄.
Resumo
Once validated, support and resistance levels are drawn as horizontal or diagonal lines, and connected to form channels indicating bullish or bearish trends. The indicator updates dynamically with each new bar, recalculating and redrawing levels to reflect the most recent price behavior.
This tool aids traders by providing a macro view of market trends, identifying zones where price may bounce or break, and simplifying technical analysis through automation. It supports setting entry and exit points, stop-loss and take-profit orders, and spotting potential breakouts or reversals. Parameters such as the number of historical bars analyzed, line thickness, and colors can be customized to fit different trading styles and preferences.


