
Dynamic Range MomentumI
インジケーター
492 ダウンロード数
バージョン 1.0、Oct 2024
Windows、Mac
5.0
レビュー: 1
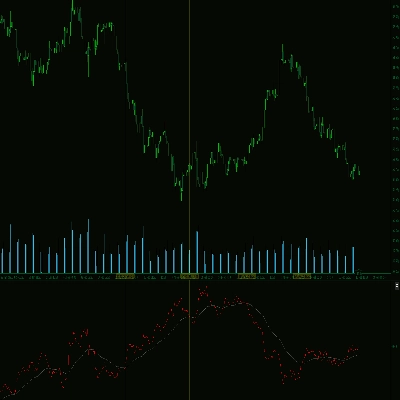
説明
- 単純移動平均(SMA)と終値の標準偏差に基づいて、**ボリンジャーバンド** 📊 を計算します。
- 移動平均と真のレンジまたは高値と安値の範囲を使用して、**ケルトナーチャネル** 📈 を計算します。
- その後、インジケーターは現在の終値と最近の高値と安値の平均の差を計算して**モメンタム** ⚡ を測定し、**ヒストグラム** を表示します:
- ポジティブなモメンタムには**緑色** 📈。
- ネガティブなモメンタムには**赤色** 📉。
このヒストグラムは、市場の動きの強さと方向を視覚化するのに役立ち、潜在的なトレンドや市場のダイナミクスの変化を見つけやすくします。
🔥 Pinescritlabs
Ctrader Store indicators: 🤖Pinescritlabs Ctrader Store cBots:
Fair Value Gap Sessions Gold & BTC Breakout Session Pivots(new)
Dynamic Market Structure
転換点の分析
Multi-Level Candle Bias
Tracker
Auto Support and
Resistance Trend Lines
概要
AIによる概要
Dynamic Range MomentumI is a trading indicator that combines Bollinger Bands and Keltner Channels to analyze market volatility and momentum. It calculates Bollinger Bands using the Simple Moving Average (SMA) and the standard deviation of closing prices, while Keltner Channels are derived from a moving average and either the true range or the range between highs and lows. The indicator measures momentum by computing the difference between the current closing price and the average of recent highs and lows. This momentum is displayed as a histogram with green bars indicating positive momentum and red bars indicating negative momentum. The histogram visually represents the strength and direction of market movements, aiding traders in identifying potential trends or shifts in market dynamics. The indicator is relevant for markets including cryptocurrencies (e.g., BTCUSD), commodities (e.g., gold, XAUUSD), and supports breakout and trend strategies.
インジケーターのプロフィール
カスタマーレビュー
5.0
レビュー: 1
5 | 100 % | |
4 | 0 % | |
3 | 0 % | |
2 | 0 % | |
1 | 0 % |
カスタマーレビュー
August 12, 2025
Pros: Adaptive momentum indicator based on price vs. recent range. Lightweight, clean chart, works across timeframes. Cons: No alerts or tooltips. Limited customization. Needs confirming indicators or thresholds.
ディスカッション
よくあるご質問
BTCUSD
Breakout
Supertrend
Commodities
RSI
Crypto
XAUUSD
Bollinger
cTrader Storeで入手可能な取引ボット、インジケーター、プラグインなどの商品は、第三者の開発者が提供するものであり、情報と技術の取得のみを目的としてご利用いただけます。cTrader Storeはブローカーではなく、投資助言や個人的な推奨を行うことも、将来のパフォーマンスを保証することもありません。


これも好きかも


価格
登録日 03/10/2024
163
販売
37.88K
無料インストール