
Описание
Скользящая средняя на основе эффективности, которая динамически регулирует скорость сглаживания в зависимости от рыночных условий.
Вычисляет сглаживание через коэффициент эффективности (направленное движение против общей волатильности), быстро реагируя на тренды и выравниваясь во время шума, чтобы избежать ложных сигналов.
Визуализация в трех состояниях (зеленый — восходящий тренд, красный — нисходящий тренд, светло-голубой — боковой тренд), настраиваемые параметры чувствительности (период, быстрое/медленное сглаживание, порог ER), автоматическое переключение между быстрым и медленным режимами и динамическое поведение поддержки/сопротивления обеспечивают адаптивное отслеживание тренда для трейдеров, которым нужна отзывчивость на направленных рынках и стабильность во время консолидации.
ОСОБЕННОСТИ
Адаптивный алгоритм
- Скорость сглаживания меняется в зависимости от коэффициента эффективности (ER) — отношения направленного движения к общей волатильности
- Быстро реагирует при увеличении эффективности
- Выравнивается при шумном движении цены, чтобы избежать ложных сигналов
- Динамическое расстояние от цены в зависимости от поведения рынка
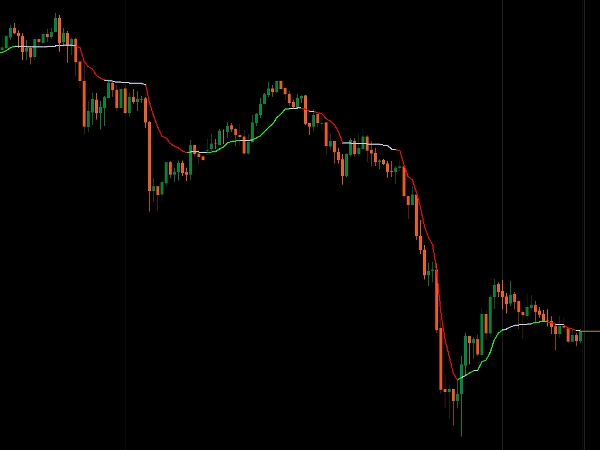
Визуализация в трех состояниях
- Зеленый: Сильный восходящий тренд (ER выше порога + растущий)
- Красный: Сильный нисходящий тренд (ER выше порога + падающий)
- Светло-голубой: Боковой/флэт (ER ниже порога)
- Мгновенное визуальное подтверждение рыночных условий
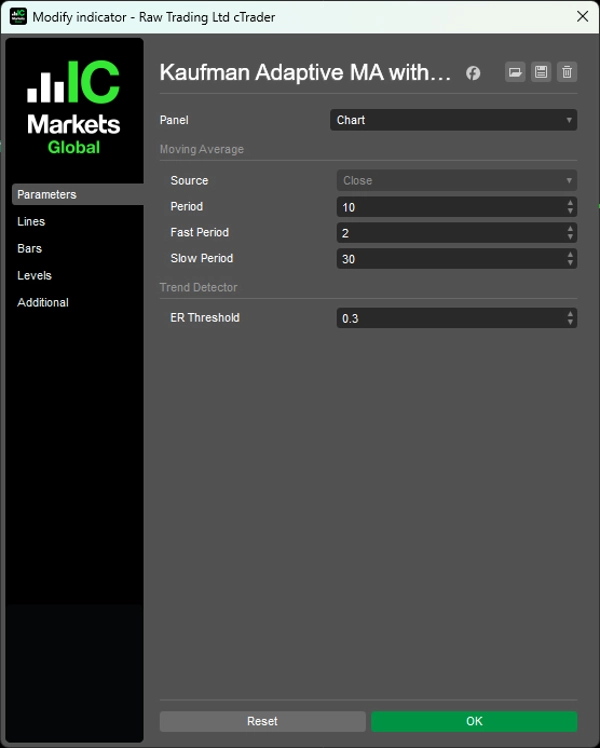
Настраиваемая чувствительность
- Период: Период для расчета эффективности (по умолчанию: 10)
- Быстрый период: Сглаживание в сильных трендах (по умолчанию: 2)
- Медленный период: Сглаживание в боковых рынках (по умолчанию: 30)
- Порог ER: Минимальная эффективность для квалификации как тренд (по умолчанию: 0.3)
Умная адаптация
- Автоматически переключается между быстрым и медленным сглаживанием
- Фильтрует шум на боковых рынках
- Раннее обнаружение трендов при смене условий
- Работает как динамическая поддержка/сопротивление
__________________________________________________________________________________________
БОЛЬШЕ БЕСПЛАТНЫХ ИНДИКАТОРОВ
Изучите широкий спектр инструментов анализа рынка — от структуры и объема до регрессии, волатильности и пользовательских таймфреймов.
Исходный код доступен в репозитории на GitHub repository.
Все бесплатно для использования. Но если хотите поддержать кофе, можете сделать это здесь.
Поддержка/Сопротивление
Объем
- Volume Activity Profiler
- Volume Efficiency Analyzer
- Volume Profile Analytics
- Volume Profile - Updated
- Volume Spread Analysis
- VWAP (Volume Weighted Average Price)
Скользящие средние
- SSL Channel
- Anchored Moving Average
- Deviation-Scaled Moving Average
- Gann High Low Activator
- Instantaneous Trendline
- Kaufman Adaptive MA with Trend Vision
- Moving Average Channel
- Moving Averages Suite
- Trend Channel Moving Average
Утилиты/Пользовательские
На основе регрессии
Волатильность
Осцилляторы
__________________________________________________________________________________________
ОТКАЗ ОТ ОТВЕТСТВЕННОСТИ
Торговля связана с риском. Этот индикатор предназначен только для технического анализа — всегда применяйте правильное управление рисками и торгуйте ответственно.
ОБРАТНАЯ СВЯЗЬ И УЛУЧШЕНИЯ
Если у вас есть предложения, запросы на функции или идеи для улучшения, пожалуйста, оставьте комментарий во вкладке Обсуждение. Ваш отзыв помогает улучшить индикатор для всех.
Сводка
Key features include a three-state color-coded visualization: green for strong uptrends, red for strong downtrends, and light blue for ranging or choppy markets, providing immediate visual insight into market states. Users can configure sensitivity parameters such as lookback period, fast and slow smoothing periods, and the ER threshold to tailor responsiveness.
The indicator automatically switches between fast and slow smoothing modes, adapting to changing market behavior. It also acts as a dynamic support and resistance tool, helping traders identify trend shifts early while filtering out noise in consolidation phases. This adaptive approach supports scalping and other trading strategies requiring both responsiveness and stability in directional and ranging markets.


