Descripción
🌟 Regresión Lineal de Fibonacci🌟
El indicador de Bandas de Regresión de Fibonacci es una herramienta técnica avanzada que combina el poder de las líneas de regresión con los niveles de Fibonacci para identificar tendencias, zonas de soporte/resistencia y posibles puntos de reversión en los mercados financieros. 📈 Este indicador ofrece una perspectiva multidimensional al analizar múltiples marcos temporales simultáneamente (5m, 15m, 30m y 4h), permitiendo a los traders localizar áreas de confluencia con mayor precisión. ⏳
🎯 ¿Qué Hace el Indicador?
El indicador crea canales de regresión basados en datos históricos de precios e integra estos con niveles de retroceso de Fibonacci, proporcionando un mapa visual completo de las zonas clave del mercado. Al analizar varios marcos temporales, ofrece una visión holística del comportamiento del precio, combinando tendencias a largo plazo con la acción del precio a corto plazo. 📊
🔍 Componentes Principales
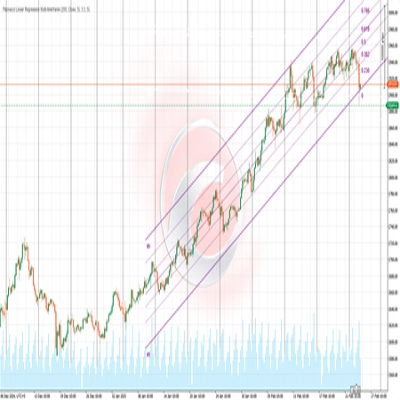
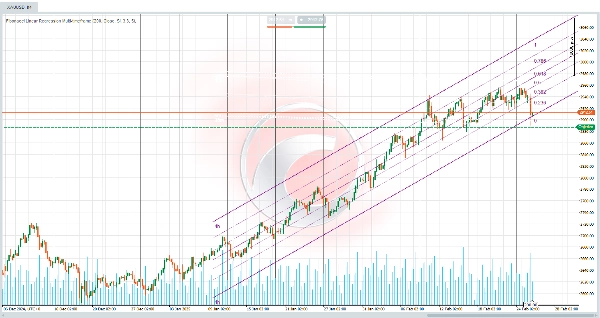
- Canales de Regresión: El indicador calcula líneas de regresión lineal durante un período definido por el usuario (por defecto: 200 barras) para mostrar la tendencia general del precio. 📉📈
- Bandas de Desviación: Se dibujan bandas superior e inferior alrededor de la línea central de regresión, representando desviaciones estadísticas del precio, similar a las Bandas de Bollinger pero basadas en regresión lineal. 📐
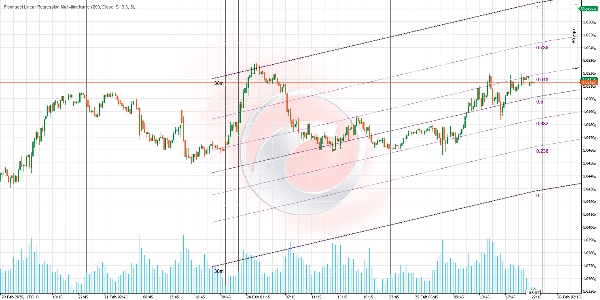
- Niveles de Fibonacci: Los niveles clásicos de Fibonacci (0, 0.236, 0.382, 0.5, 0.618, 0.786 y 1) se trazan dentro del canal, ofreciendo posibles puntos de rebote o continuación. 🔢
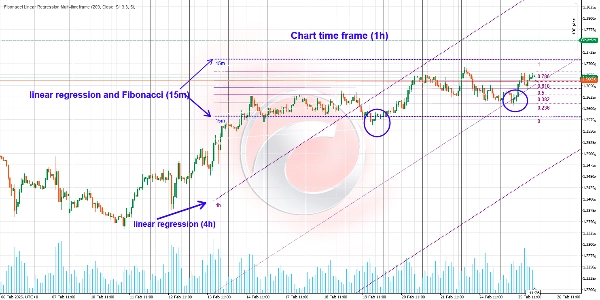
- Análisis Multitemporal: El análisis simultáneo de marcos temporales de 5 minutos, 15 minutos, 30 minutos y 4 horas, cada uno representado con colores distintos, ayuda a identificar zonas donde múltiples marcos temporales coinciden. 🎨
🔄 Análisis Multidimensional del Mercado
Esta estrategia te permite ver el mercado desde múltiples ángulos, integrando tendencias a largo plazo con movimientos de precio a corto plazo. Este enfoque permite:
- Ajustar dinámicamente las operaciones a medida que evoluciona el mercado. 🔄
- Cambiar entre marcos temporales según sea necesario. ⏱️
- Capturar movimientos grandes dentro de la tendencia principal. 🚀
- Aprovechar fluctuaciones menores para optimizar puntos de entrada y salida. 🎯
🔄 Interacción Entre Marcos Temporales
Marco Temporal de 4 Horas con Canal de Regresión
- Proporciona una visión de la tendencia dominante. 💪
- Ofrece una base sólida para evaluar la dirección general del mercado.
- En este contexto, los niveles de Fibonacci pueden desactivarse para evitar saturación visual.
- El enfoque permanece en el canal de regresión que muestra la tendencia predominante.
Marcos Temporales Inferiores con Regresión y Fibonacci
- Activa líneas de regresión y niveles de Fibonacci en marcos temporales más cortos (5m, 15m o 30m).
- Obtén señales más precisas dentro del contexto de la tendencia más amplia.
- Los niveles de Fibonacci ayudan a identificar posibles puntos de entrada y salida dentro del marco temporal mayor.
📊 Cómo Interpretar los Resultados
Identificación de Tendencias
- La dirección de la línea central de regresión indica la tendencia dominante (alcista, bajista o lateral). 📈📉➡️
- La pendiente de la línea sugiere la fuerza de la tendencia—pendientes más pronunciadas indican tendencias más fuertes. 🔍
- La convergencia de líneas de regresión de diferentes marcos temporales en la misma dirección significa una tendencia fuerte y confiable.
Zonas de Soporte y Resistencia
- Las bandas superior e inferior actúan como zonas dinámicas de soporte y resistencia. 🛡️
- Los niveles de Fibonacci dentro del canal proporcionan soporte/resistencia adicional, especialmente en 0.618 y 0.382.
- Cuando los niveles de Fibonacci de diferentes marcos temporales se alinean, crean zonas de confluencia de alta probabilidad.
🌐 Identificación de Zonas de Confluencia
Las zonas de confluencia ocurren donde se superponen líneas de regresión y niveles de Fibonacci. Estas áreas representan puntos probables de reacción significativa del precio:
- Cuando un retroceso de Fibonacci se alinea con el borde superior o inferior de un canal de regresión, actúa como un fuerte punto de soporte o resistencia.
- Cuando las líneas de regresión de diferentes marcos temporales se cruzan o convergen.
- Cuando los niveles de Fibonacci de múltiples marcos temporales coinciden en un área específica.
- Cuando el precio rebota precisamente en un nivel de Fibonacci que coincide con una línea del canal de regresión.
🔄 Identificación de Zonas de Reversión
Si el precio rompe el canal de regresión en un marco temporal menor y se acerca a un nivel clave de Fibonacci, puede señalar una posible reversión. Signos adicionales de reversión incluyen:
- Sobreextensión: Cuando el precio alcanza o supera la banda superior/inferior, especialmente cuando está alineado con niveles de Fibonacci en múltiples marcos temporales.
- Divergencia con indicadores de momentum: Usar este indicador junto con RSI, MACD u otros puede mejorar la detección de divergencias.
- Ruptura de la Línea Central: Cruzar la línea central de regresión puede señalar un cambio en la dinámica del precio, particularmente si ocurre simultáneamente en múltiples marcos temporales.
🧩 Multiplicidad de Escenarios
Usar diversas combinaciones de canales de regresión y niveles de Fibonacci en múltiples marcos temporales puede crear escenarios de trading variados:
- Mantener una posición larga en el marco temporal de 4 horas mientras se opera simultáneamente en marcos temporales menores para capitalizar los rebotes de Fibonacci.
- Identificar la tendencia principal usando el canal de regresión de 4 horas y encontrar entradas óptimas durante retrocesos a niveles de Fibonacci en marcos temporales menores.
- Usar confluencias a través de múltiples marcos temporales para confirmar puntos de entrada y salida de alta probabilidad.
📈 Estrategias de Trading
Estrategia de Reversión
- Identificar zonas donde múltiples niveles de Fibonacci y bandas de diferentes marcos temporales convergen.
- Esperar confirmación del precio (patrones de velas, divergencias, etc.).
- Entrar contra la tendencia previa con un stop loss ajustado.
- Establecer objetivos en el siguiente nivel de Fibonacci o en la línea central de regresión.
Estrategia de Continuación
- Buscar retrocesos hacia la línea central o niveles clave de Fibonacci (0.382 o 0.618).
- Confirmar que la tendencia general se mantiene intacta en múltiples marcos temporales.
- Entrar en la dirección de la tendencia cuando el precio rebote en estos niveles.
- Colocar stop loss por debajo/encima del nivel relevante de Fibonacci.
Al aprovechar el indicador de Regresión Lineal de Fibonacci, los traders pueden obtener una comprensión más profunda de la dinámica del mercado y tomar decisiones de trading más informadas. ¡Mantente alerta y opera inteligentemente! 💻📈
Indicadores de la Tienda Ctrader:
Sesiones de Brecha de Valor Justo
Estructura Dinámica del Mercado
Análisis de Puntos de Giro
Regresión Lineal de Fibonacci
Multitemporal
Mapa de Calor de POC de Volumen
Brecha de Valor Justo de Momentum
Proyección de Flujo de Mercado
Gradiente de Tendencia Dinámico
Sesgo de Vela Multinivel
Rastreador
Rastreador de Extremos Zig-Zag
Soporte y
Líneas de Tendencia de Resistencia Automáticas
Todos los Niveles de
Soporte y Resistencia
Resumen
This indicator performs simultaneous analysis across multiple timeframes—5-minute, 15-minute, 30-minute, and 4-hour—each displayed in distinct colors to identify confluence zones where signals from different timeframes align. The 4-hour timeframe focuses on the dominant trend using regression channels, while shorter timeframes include Fibonacci levels for precise entry and exit signals.
Traders can interpret the slope and direction of regression lines to assess trend strength and direction. Upper and lower bands act as dynamic support and resistance, with Fibonacci levels providing additional key zones. Confluence of regression lines and Fibonacci levels across timeframes highlights high-probability reaction points. The indicator supports reversal and continuation strategies by identifying key zones and confirming price action with multi-timeframe context.
Valoraciones de clientes
5 | 100 % | |
4 | 0 % | |
3 | 0 % | |
2 | 0 % | |
1 | 0 % |


