คำอธิบาย
รุ่นขยายมีให้ใช้งาน — ที่นี่
คุณกำลังดูเวอร์ชันต้นฉบับอยู่ รุ่นขยายของตัวบ่งชี้นี้ได้รับการปล่อยออกมาพร้อมฟีเจอร์เพิ่มเติม:
- การแสดงอายุที่ปรับปรุงแล้ว: รูปแบบปี เดือน สัปดาห์ วัน (เช่น "3y 2w 4d")
- แสดง FVG ทั้งหมด: ตั้งค่า "FVG to Display" เป็น -1 เพื่อแสดง FVG ประวัติไม่จำกัด
- ขยาย FVG ที่เติมเต็มแล้ว: ตัวเลือกในการขยายกล่อง FVG ที่เติมเต็มถึงแท่งปัจจุบัน
- ระดับฟีโบนักชี: ระดับอัตโนมัติ (23.6%, 38.2%, 50%, 61.8%, 78.6%) บน FVG ส่วนหนึ่งและที่เติมเต็มแล้ว
- เกณฑ์การเติมเต็มบางส่วน: เกณฑ์ปรับแต่งได้ (50-99%, ค่าเริ่มต้น 90%)
__________________________________________________________________________________________
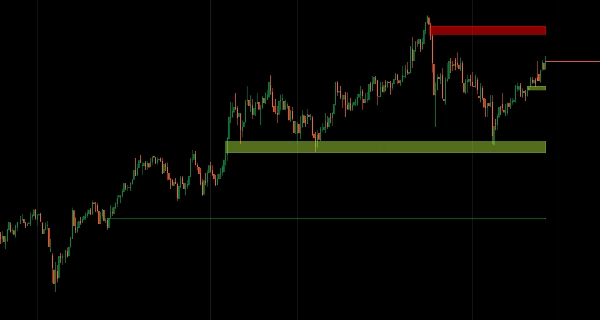
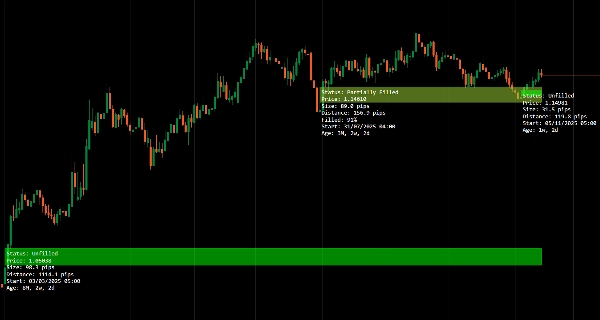
ระบุช่องว่างมูลค่ายุติธรรมด้วยการติดตามอายุและการตรวจสอบสถานะการเติมเต็ม
ตรวจจับช่องว่างขาขึ้นและขาลงโดยอัตโนมัติ ติดตามพฤติกรรมการเติมเต็ม (ยังไม่เติมเต็ม, เติมเต็มบางส่วน, เติมเต็มเต็มที่) แบบเรียลไทม์ และแสดงอายุช่องว่างเพื่อจัดลำดับความสำคัญ
สแกนหลายกรอบเวลาเพื่อจัดช่องว่างโครงสร้าง HTF ให้สอดคล้องกับราคากรอบเวลาต่ำ LTF อัปเดตสถานะแบบไดนามิกเมื่อราคาติดต่อกับโซน และแสดงป้ายกำกับที่ไม่รบกวนเพื่อวิเคราะห์ความไม่สมดุลของสภาพคล่องอย่างมีจุดมุ่งหมายสำหรับเทรดเดอร์ที่มุ่งเป้าหมายการเติมเต็มช่องว่างและการเข้าตามโครงสร้าง
คุณสมบัติ
การระบุ FVG
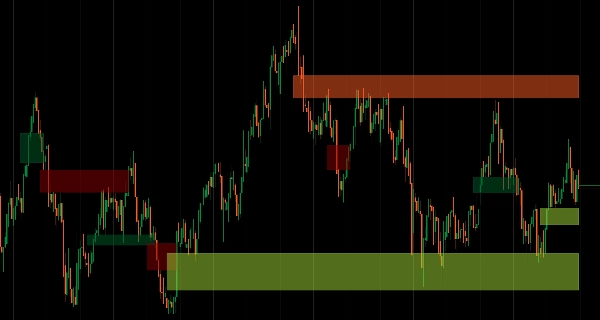
- ตรวจจับช่องว่างมูลค่ายุติธรรมขาขึ้นและขาลงโดยอัตโนมัติ
- ติดตามสถานะยังไม่เติมเต็ม เติมเต็มบางส่วน และเติมเต็มเต็มที่แบบเรียลไทม์
- แสดงผลภาพที่สะอาดโดยมีความรกบนกราฟน้อยที่สุด
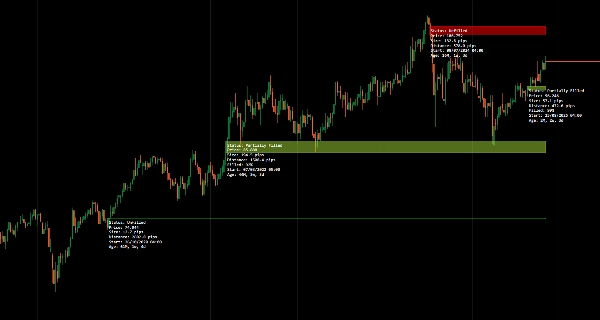
การติดป้ายอายุ
- แสดงเวลาที่ผ่านไปตั้งแต่ช่องว่างแต่ละช่องก่อตัวขึ้น
- ช่วยจัดลำดับความสำคัญช่องว่างใหม่กับช่องว่างเก่าสำหรับการเลือกเทรด
- บริบทเวลาช่วยปรับปรุงการตัดสินใจเกี่ยวกับความเกี่ยวข้องของช่องว่าง
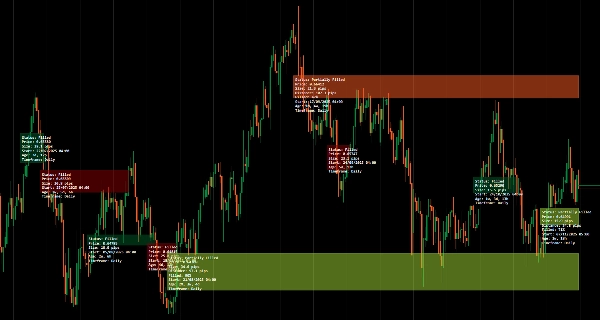
การติดตามสถานะ
- แสดงสถานะการเติมเต็มปัจจุบัน: ยังไม่เติมเต็ม, เติมเต็มบางส่วน หรือเติมเต็มเต็มที่
- อัปเดตแบบไดนามิกเมื่อราคาติดต่อกับช่องว่าง
- ยืนยันภาพการจับสภาพคล่อง
โหมดหลายกรอบเวลา
- สแกนและแสดง FVG ของกรอบเวลาที่สูงกว่าบนกราฟกรอบเวลาที่ต่ำกว่า
- จัดช่องว่างโครงสร้าง HTF ให้สอดคล้องกับราคากรอบเวลาต่ำ LTF
- ปรับปรุงเวิร์กโฟลว์การวิเคราะห์หลายกรอบเวลา
UI ที่สะอาดและเรียบง่าย
- ป้ายกำกับที่ไม่รบกวนออกแบบมาเพื่อความชัดเจน
- ให้ข้อมูลโดยไม่ทำให้มุมมองราคาของคุณรก
- การนำเสนออย่างมืออาชีพเพื่อการวิเคราะห์ที่มุ่งเน้น
__________________________________________________________________________________________
ตัวบ่งชี้ฟรีเพิ่มเติม
สำรวจเครื่องมือวิเคราะห์ตลาดหลากหลายประเภท — ตั้งแต่โครงสร้างและปริมาณไปจนถึงการถดถอย ความผันผวน และกรอบเวลาที่กำหนดเอง
ซอร์สโค้ดมีให้บน GitHub ที่เก็บ.
ทั้งหมดใช้ฟรี แต่ถ้าคุณต้องการสนับสนุนด้วยกาแฟ คุณสามารถส่งได้ ที่นี่.
แนวรับ/แนวต้าน
ปริมาณ
- โปรไฟล์กิจกรรมปริมาณ
- ตัววิเคราะห์ประสิทธิภาพปริมาณ
- การวิเคราะห์โปรไฟล์ปริมาณ
- โปรไฟล์ปริมาณ - อัปเดต
- การวิเคราะห์การกระจายปริมาณ
- VWAP (ราคาเฉลี่ยถ่วงน้ำหนักด้วยปริมาณ)
ค่าเฉลี่ยเคลื่อนที่
- ค่าเฉลี่ยเคลื่อนที่แบบยึดจุด
- ค่าเฉลี่ยเคลื่อนที่แบบปรับสเกลด้วยส่วนเบี่ยงเบน
- เส้นแนวโน้มทันที
- Kaufman Adaptive MA พร้อม Trend Vision
- ช่องค่าเฉลี่ยเคลื่อนที่
- ชุดค่าเฉลี่ยเคลื่อนที่
- ค่าเฉลี่ยเคลื่อนที่ช่องแนวโน้ม
ยูทิลิตี้/กำหนดเอง
แบบถดถอย
ความผันผวน
ออสซิลเลเตอร์
__________________________________________________________________________________________
ข้อจำกัดความรับผิดชอบ
การซื้อขายมีความเสี่ยง ตัวบ่งชี้นี้มีไว้สำหรับการวิเคราะห์ทางเทคนิคเท่านั้น — โปรดใช้การจัดการความเสี่ยงที่เหมาะสมและซื้อขายอย่างรับผิดชอบเสมอ
ข้อเสนอแนะ & การปรับปรุง
หากคุณมีข้อเสนอแนะ คำขอฟีเจอร์ หรือไอเดียสำหรับการปรับปรุง โปรดแสดงความคิดเห็นในแท็บอภิปราย ข้อเสนอแนะของคุณช่วยปรับปรุงตัวบ่งชี้สำหรับทุกคน
สรุป
รีวิวจากลูกค้า
5 | 100 % | |
4 | 0 % | |
3 | 0 % | |
2 | 0 % | |
1 | 0 % |