Mô tả
PHIÊN BẢN NÂNG CẤP CÓ SẴN TẠI ĐÂY
Bạn đang tìm kiếm nhiều hơn chỉ là các lớp phủ khung thời gian gốc? Chỉ báo Khung Thời Gian Tùy Chỉnh nâng cấp mở rộng khái niệm này với các bổ sung mạnh mẽ:
- Các khoảng thời gian không chuẩn (5H, 7H, 9H-23H, 25m, 35m, 50m, 55m, 4 ngày, 2 tuần, 3 tuần, nhiều tháng, nhiều năm)
- Đường OHLC với điều khiển dịch thanh cho các thanh đã hoàn thành hoặc đang hình thành
- Bảy mức Fibonacci (11.4% đến 88.6%) với vùng cân bằng được làm nổi bật
- Các đường trung bình động được tính toán trực tiếp trên cấu trúc khung thời gian tùy chỉnh (9 loại MA, 8 nguồn giá)
- Nút chuyển đổi để quản lý tính năng nhanh chóng.
Nếu bạn cần các khoảng thời gian giữa các khoảng biểu đồ tiêu chuẩn với lớp phủ phân tích kỹ thuật đầy đủ, hãy xem phiên bản nâng cấp.
__________________________________________________________________________________________
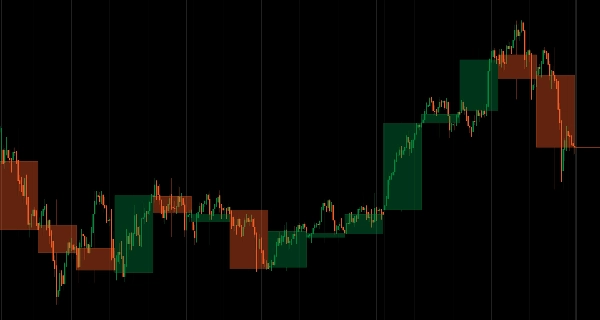
Phủ nến HTF thời gian thực lên bất kỳ biểu đồ nào mà không cần chuyển đổi khung thời gian.
Hiển thị cấu trúc nến khung thời gian cao hơn (thân và bấc) trực tiếp trên các biểu đồ khung thời gian thấp hơn với cập nhật trực tiếp khi khoảng thời gian tiến triển.
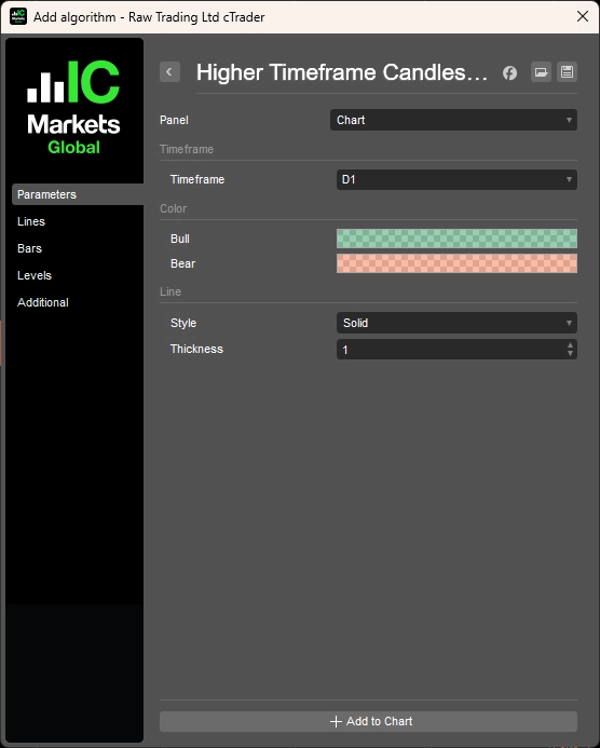
Lựa chọn khung thời gian linh hoạt (Hàng ngày trên H1, Hàng tuần trên H4, Hàng tháng trên Hàng ngày), mã màu xu hướng tăng/giảm (xanh lá/đỏ), kiểu đường và độ trong suốt tùy chỉnh, cùng hiệu suất nhẹ cung cấp bối cảnh HTF liên tục cho các nhà giao dịch theo dõi cấu trúc trên nhiều khung thời gian mà không cần chuyển đổi biểu đồ.
TÍNH NĂNG
Lựa chọn Khung Thời Gian Linh Hoạt
- Bất kỳ HTF nào: Hàng ngày trên H1, Hàng tuần trên H4, Hàng tháng trên Hàng ngày—lựa chọn của bạn
- Cập nhật thời gian thực: Nến HTF được vẽ lại khi khoảng thời gian tiến triển
- Luôn trong tầm nhìn: Giao dịch các khung thời gian thấp hơn trong khi duy trì bối cảnh khung thời gian cao hơn
Độ Rõ Ràng Hình Ảnh
- Mã màu: Tăng (xanh lá), Giảm (đỏ)—xác nhận xu hướng ngay lập tức
- Tùy chỉnh: Kiểu đường, độ dày, độ trong suốt
- Trình bày sạch sẽ: Thân và bấc được hiển thị rõ ràng
Tích Hợp Đơn Giản
- Không cần chuyển đổi khung thời gian
- Duy trì bối cảnh biểu đồ trong khi hiển thị cấu trúc HTF
- Nhẹ và tối ưu hiệu suất
__________________________________________________________________________________________
THÊM CÁC CHỈ BÁO MIỄN PHÍ
Khám phá một loạt các công cụ phân tích thị trường—từ cấu trúc và khối lượng đến hồi quy, biến động và khung thời gian tùy chỉnh.
Mã nguồn có sẵn trên kho lưu trữ GitHub repository.
Tất cả đều miễn phí sử dụng. Nhưng nếu bạn muốn gửi hỗ trợ cà phê, bạn có thể chuyển nó tại đây.
Hỗ Trợ/Kháng Cự
Khối Lượng
- Volume Activity Profiler
- Volume Efficiency Analyzer
- Volume Profile Analytics
- Volume Profile - Updated
- Volume Spread Analysis
- VWAP (Giá Trung Bình Trọng Số Khối Lượng)
Đường Trung Bình Động
- Đường Trung Bình Động Neo
- Đường Trung Bình Động Tỷ Lệ Độ Lệch
- Đường Xu Hướng Tức Thời
- Đường Trung Bình Động Thích Nghi Kaufman với Tầm Nhìn Xu Hướng
- Kênh Đường Trung Bình Động
- Bộ Đường Trung Bình Động
- Đường Trung Bình Động Kênh Xu Hướng
Tiện Ích/Tùy Chỉnh
Dựa Trên Hồi Quy
Biến Động
Bộ Dao Động
__________________________________________________________________________________________
TỪ CHỐI TRÁCH NHIỆM
Giao dịch có rủi ro. Chỉ báo này chỉ dành cho phân tích kỹ thuật — luôn áp dụng quản lý rủi ro phù hợp và giao dịch có trách nhiệm.
PHẢN HỒI & CẢI TIẾN
Nếu bạn có đề xuất, yêu cầu tính năng hoặc ý tưởng cải tiến, vui lòng để lại bình luận trong tab Thảo luận. Phản hồi của bạn giúp cải thiện chỉ báo cho mọi người.