
S&R Structural ZigZag
指标
602 下载
版本 1.0, Jun 2025
Windows 版、Mac 版
5.0
评价:1
说明
Pinescriptlabs 商店指标: 🤖Pinescriptlabs 商店 cBots :(cBot)
价格行为 (新)
尾随智能算法(新)
带摆动的之字形支撑与阻力
1. 这个指标的作用是什么? ❓
🔍 检测价格摆动(高点与低点)
- 扫描最近的柱子(“分析深度”)以找到该范围内的最高/最低价格。
- 用百分比阈值(例如,相较于上一个摆动变化超过1%)验证摆动 → 标记新的 ✅ 摆动高点/低点。
- 减少噪音 ⚡:仅当分析周期的一半内没有更高高点/更低低点时确认摆动。
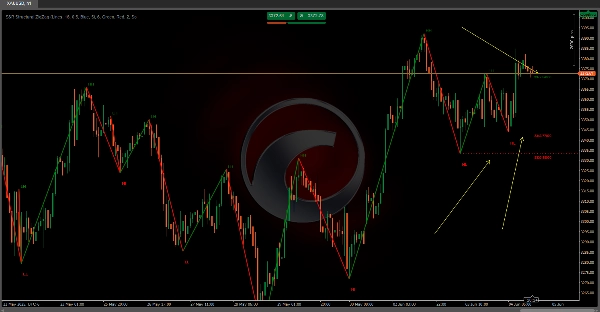
📉 绘制之字形趋势线
- 用动态线连接摆动:
-
- 🟢 绿色 = 上升趋势(新摆动 > 之前)。
- 🔴 红色 = 下降趋势(新摆动 < 之前)。
⏹️ 突出关键水平
- 支撑/阻力线:绘制于每个摆动的精确价格,向右延伸
- 标签显示价格值 📌 (例如,“1.1050”)以便即时分析。
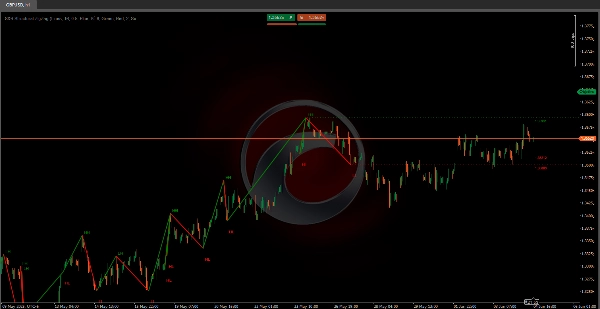
🚦 揭示市场结构
- 一目了然地识别趋势:
-
- 看涨 = 更高高点 (HH) + 更高低点 (HL)。
- 看跌 = 更低高点 (LH) + 更低低点 (LL)。
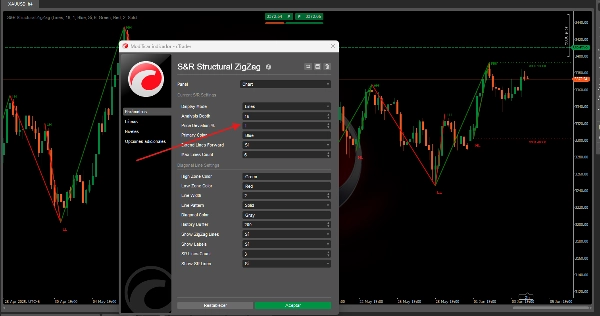
2. 如何使用(设置指南) ⚙️
安装到 cTrader:拖放到您的图表上!
关键设置:
- 分析深度 🔎:
10(默认)→ 较高数值过滤噪音;较低数值捕捉更多摆动。 - 价格偏差百分比 📏:
1.0%(可调节)→ 验证摆动的最小价格变动。 - 摆动标签 🏷️(HH/HL/LH/LL):开关切换。
- 延伸线条 ➡️:无限延伸支撑/阻力水平或限制于当前柱子。
摘要
指标配置
客户评价
5.0
评价:1
5 | 100 % | |
4 | 0 % | |
3 | 0 % | |
2 | 0 % | |
1 | 0 % |
客户评价
August 18, 2025
Clear structural support/resistance mapping, customizable, lightweight. Cons: No auto-labels, no historical level tracking, no alerts.
讨论
常见问答
BTCUSD
Breakout
Supertrend
Commodities
RSI
Crypto
XAUUSD
cTrader Store 提供的所有产品,包括交易机器人、指标和插件,均由第三方开发者提供,仅供信息参考和技术访问之用。cTrader Store 并非经纪商,不提供投资建议、个人推荐或任何未来业绩保证。


!["[Hamster-Coder] Bollinger Bands" 标识](https://cdn.ctrader.com/image/webp/21d8e5d6-fb11-4bac-b9ee-cd05c2b76804_30327)


价格
注册日期 03/10/2024
163
销售
37.72K
免费安装