
الوصف
مؤشرات متجر Pinescriptlabs: 🤖متجر Pinescriptlabs cBots : (cBot) اختراق الذهب و BTCنقاط محورية الجلسة(جديد)
دعم SmartTrend و
المقاومة
خطوط
تحليل
هيكل السوق الديناميكي
لـ
نقاط
الانعطاف
فيبوناتشي
انحدار خطي
متعدد الأطر الزمنية
متعدد الأطر الزمنية
متعدد المستويات
انحياز الشمعة
المتعقب
دعم تلقائي و
مقاومة
اتجاه
خطوط
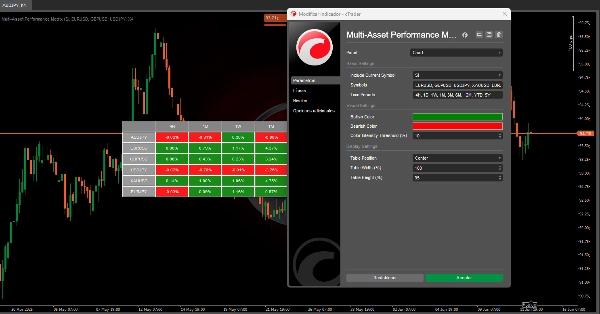
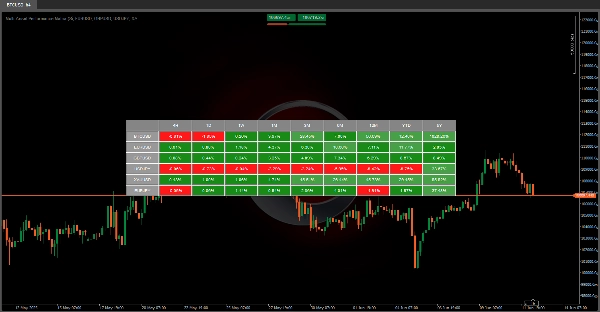
🚀 مصفوفة أداء متعددة الأصول 🚀
هذا الخوارزم هو أداة بصرية قوية 📊 مصممة لعرض نسبة الأداء لعدة أدوات مالية عبر فترات زمنية مختلفة.
يقوم بتحويل البيانات التاريخية إلى تصور فعال وبديهي، مما يسمح للمستخدمين بتقييم سلوك الأصول المالية المختلفة بسرعة.
❓ ماذا تفعل هذه الأداة؟
1️⃣ 📈 تقارن الأصول: تعرض كيف تغيرت أسعار الأدوات المالية المختلفة (مثل BTCUSD, EURUSD, XAUUSD، إلخ) مع مرور الوقت.
- الأطر الزمنية: D (يومي) | 1W (أسبوعي) | 1M (شهري) | 3M (ربع سنوي) | 6M (نصف سنوي) | 12M (سنوي) | YTD (من بداية السنة) | 5Y (آخر 5 سنوات)
2️⃣ 🎨 يبرز الاتجاهات: يستخدم ترميز الألوان (🟢, 🔴 ) لتحديد الأصول الصاعدة أو الهابطة في كل فترة على الفور.
3️⃣ ⏱️ تحديث تلقائي: يقوم بتحديث البيانات كل دقيقة لعكس أحدث معلومات السوق.
💡 لماذا هذا مفيد؟
✔ 📊 تحليل مقارن: يتيح مقارنة جنبًا إلى جنب لعدة أصول—مثالي لـ إدارة المحافظ أو اختيار الأصول الأعلى أداءً بناءً على الأطر الزمنية.
✔ 🛡️ التحكم: تقييم ثبات (أو تقلب) الأصل عبر فترات مختلفة يساعد في تقييم المخاطر المرتبطة.
✨ المفتاح
✅ ⏳ يوفر الوقت: جمع وحساب هذه البيانات يدويًا سيستغرق ساعات— هذه الأداة تفعل ذلك فورًا!
✅ 👀 واضح بصريًا: النظام المرمز بالألوان يجعل التحليل سهلاً، حتى للمستخدمين غير التقنيين.
✅ 🔄 قابل للتكيف: يدعم الرموز المخصصة، بحيث يمكنك تتبع الأصول التي تهمك.
الملخص
تقييمات العملاء
5 | 100 % | |
4 | 0 % | |
3 | 0 % | |
2 | 0 % | |
1 | 0 % |


