
Beschreibung
Beschreibung
Pinescriptlabs Store Indikatoren: 🤖Pinescriptlabs Store cBots :
ICT Power of 3 (cBot) Gold & BTC BreakoutSession Pivots(neu)YieldShield"
SmartTrend Support &
Resistance Lines
Dynamische Marktstruktur
Analyse von Wendepunkten
Fibonacci Linear
Regression Multi-Zeitrahmen
Multi-Level Kerzen-Bias
Tracker
Reaktive Gleitender Durchschnitt
Auto Support und
Resistance Trend Lines
Alle Unterstützungs- und
Widerstandsniveaus
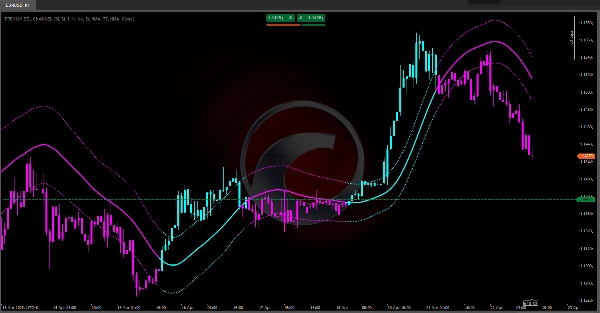
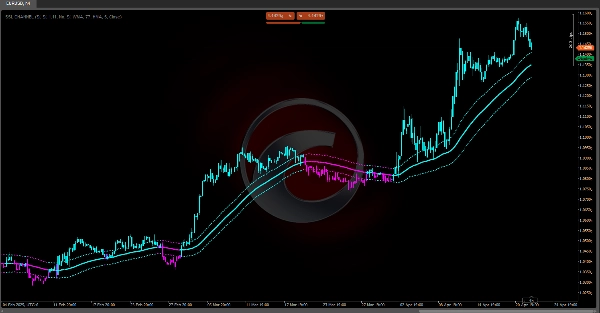
Der Premium SSL-Kanal 🔍
Kombiniert Trenderkennung über einen gleitenden Durchschnitt, Volatilitätsbewertung mit ATR-basierten Bändern und einen Kurzzeitfilter (SSL) für ein integriertes Analysesystem. 💡 Seine Stärke liegt in der Klarheit seiner visuellen Signale und Anpassungsfähigkeit über Märkte hinweg, während seine Haupt-Herausforderung die Minimierung von Verzögerungen und das Filtern von Seitwärtsbewegungen ist. Mit richtiger Parametrierung wird es zu einem leistungsstarken Werkzeug für Ein- und Ausstiegsentscheidungen im Trading. 🎯
1. Zweck & Handelsnutzen 📊
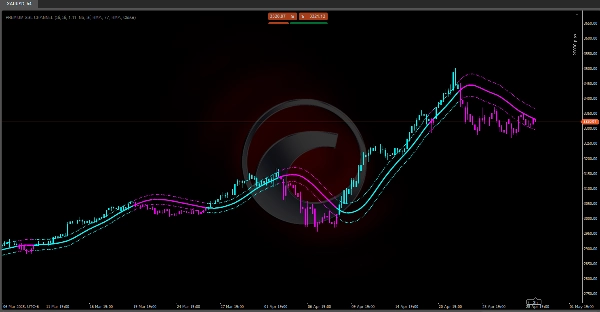
• Haupt-Trenderkennung: Dank einer zentralen Linie (der "Baseline") zeigt der Indikator die dominierende Marktrichtung. 📈📉
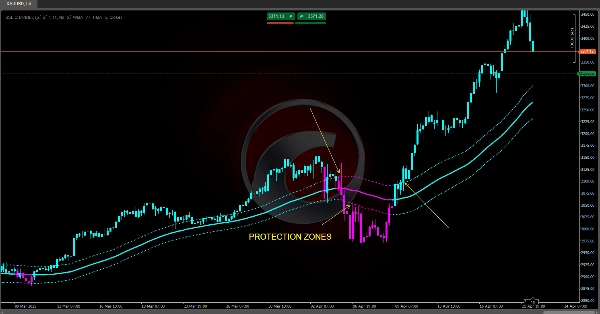
• Volatilitätsmessung: Mithilfe einer durchschnittlichen Spanne (ATR) passt er zwei Bänder (über/unter der Baseline) als dynamische Unterstützungs-/Widerstandsbereiche an. ⚡
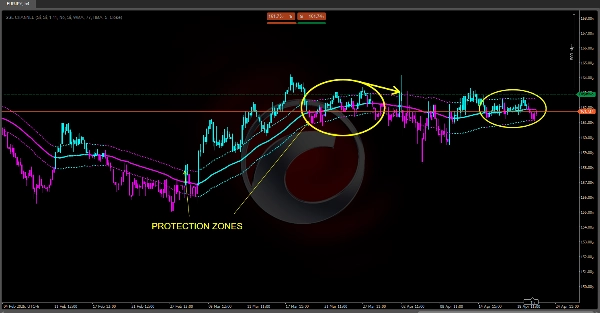
• Rauschfilter & Bias-Verschiebung: Der SSL-Kanal (ein adaptiver gleitender Durchschnitt basierend auf Hochs/Tiefs) identifiziert kurzfristige Umkehrungen für präzise Ein- und Ausstiege. 🔄
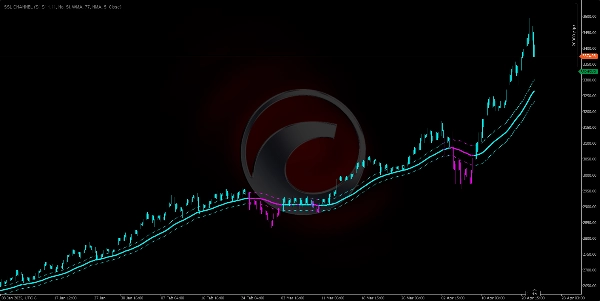
• Intuitive Visualisierung: Färbt Kurskerzen und Linien nach Bias (cyan = bullisch, magenta = bärisch) für sofortige Interpretation. 🎨
2. Kernkomponenten & Logik ⚙️
2.1. Zentrale Linie ("Baseline")
• Berechnet einen gleitenden Durchschnitt des Preises (SMA, EMA, WMA oder Hull), um Rauschen zu glätten.
• Repräsentiert den durchschnittlichen Marktwert und zeigt den dominierenden Trend:
- Preis über → Bullischer Trend. 🟢
- Preis unter → Bärischer Trend. 🔴
2.2. Durchschnittliche Spanne (ATR)
• Misst die tatsächliche Marktvolatilität durch Mittelung vorheriger Hochs/Tiefs/Schlusskurse.
• Höherer ATR = Mehr Volatilität; Niedriger ATR = Ruhigere Märkte. 🌊
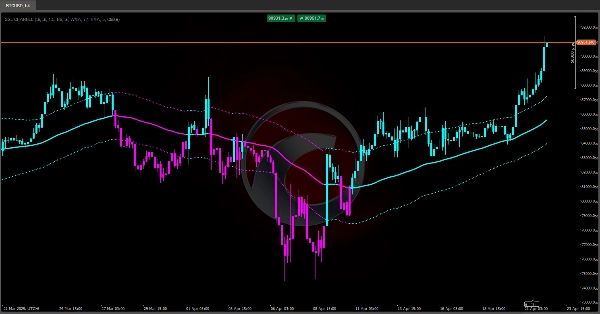
2.3. Dynamische Bänder ("Up ATR" & "Down ATR")
• Up ATR = Baseline + (ATR × Multiplikator)
• Down ATR = Baseline – (ATR × Multiplikator)
• Dient als Preiskanäle:
- Preis berührt oberes Band → Bullische Stärke. 🚀
- Preis nahe unterem Band → Bärisches Momentum. 🐻
2.4. SSL-Kanal (Signal-Smooth-Line)
• Verwendet gleitende Durchschnitte auf Hochs/Tiefs separat.
• Richtungslogik:
- Schlusskurs über dem hohen MA → Bullischer Bias. ✅
- Schlusskurs unter dem niedrigen MA → Bärischer Bias. ❌
- Dazwischen → Vorheriger Bias bleibt bestehen.
• Dient als Kurzzeit-Trendfilter, der die Baseline bestätigt oder widerspricht. 🔄
3. Signalgenerierung & Praktische Anwendung 🛠️
1. Trendbestätigung
- Stark bullisch: Preis > Up ATR. 🟢
- Mäßig bullisch: Up ATR > Preis > Baseline.
- Mäßig bärisch: Baseline > Preis > Down ATR.
- Stark bärisch: Preis < Down ATR. 🔴
2. SSL-Filter
- Einstiege: Long nur, wenn SSL über seiner Linie ist (oder Short, wenn darunter). ⬆⬇
- Ausstiege: Teilweise/vollständig bei SSL-Umkehr und Kreuzung des gegenüberliegenden hohen/niedrigen MA. ✋
3. Balkenfärbung
- Preis-Balken werden cyan (bullisch) oder magenta (bärisch), synchron mit der Baseline für schnelle Marktinterpretationen. 🎨
4. Konfigurierbare Parameter & Auswirkungen ⚖️
• Baseline-Periode: Länger = glatter, aber verzögert; kürzer = reaktionsschneller, aber rauschiger. 🐢⚡
• Band-Multiplikator: Höher = breiterer Kanal (weniger Fehlsignale); niedriger = enger (mehr Signale, mehr Fehlausbrüche). ↔️
• MA-Typ (SMA/EMA/WMA/HMA): Beeinflusst die Gewichtung von aktuellen vs. historischen Preisen. 📅
• SSL-Periode & Typ: Definiert die Empfindlichkeit des Kurzzeitfilters. 🎚️
Zusammenfassung
Kundenbewertungen
5 | 100 % | |
4 | 0 % | |
3 | 0 % | |
2 | 0 % | |
1 | 0 % |


