Descripción
Indicadores de Pinescriptlabs Store: cBots de Pinescriptlabs Store : (cBot) Gold & BTC BreakoutSession Pivots(nuevo)
Mapa de Liquidación de Apalancamiento
Predicción Basada en Linreg & ATR
Líneas de Soporte y
Resistencia SmartTrend
Sesiones de Brecha de Valor Justo
Análisis
Dinámico de Estructura
de Mercado
de
Puntos
de Giro
Regresión
Lineal
Fibonacci
Multi-temporal
Brecha de Valor Justo de Momentum
Proyección de Flujo de Mercado
Gradiente de Tendencia Dinámico
Rastreador de
Sesgo de Velas
Multi-nivel
Rastreador de Extremos Zig-Zag
Líneas de
Soporte y
Resistencia
Automáticas
Todos
los Niveles de
Soporte y
Resistencia
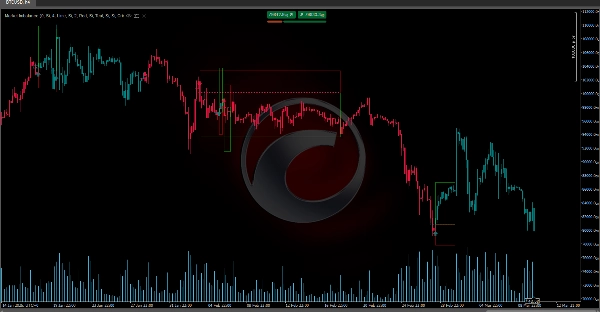
MarketImbalanceDetector identifica desequilibrios del mercado y marca visualmente áreas clave basadas en patrones de precio y volatilidad (ATR). Aquí hay un desglose simple de cómo funciona:
🔍 Detección de Señales
Compara los precios de barras anteriores para detectar patrones alcistas o bajistas. Usando condiciones específicas (como comparar mínimos y máximos de barras anteriores) y filtrando señales con la volatilidad actual, asegura que el movimiento sea significativo.
📊 Visualización de Desequilibrios
Cuando se identifica una señal, el indicador dibuja en el gráfico:
- Un Área de Desequilibrio (un rectángulo) que marca la zona donde ocurrió el patrón.
- Una Línea de Nivel Promedio (calculada a partir de máximos y mínimos relevantes) para ayudar a visualizar soporte o resistencia.
- Un Ícono (una flecha) que indica la dirección de la señal (⬆️ para alcista, ⬇️ para bajista).
Zonas OP/PE
Además, crea zonas llamadas OP () y PE (Punto de Escape). Estas zonas se calculan sumando o restando un múltiplo del ATR al nivel promedio, ayudando a definir áreas para tomar ganancias o cortar pérdidas.
Resumen
When a signal is detected, the indicator visually marks the chart with:
- An Imbalance Area (a rectangle) highlighting the zone where the pattern occurred.
- An Average Level Line calculated from relevant highs and lows to indicate potential support or resistance.
- An Icon (arrow) showing the signal direction: upward for bullish and downward for bearish.
Additionally, the indicator calculates OP (Order Point) and PE (Escape Point) zones by adding or subtracting multiples of ATR to the average level. These zones assist traders in defining areas for taking profit or cutting losses.
This tool supports analysis across various markets including cryptocurrencies (e.g., BTCUSD), commodities (e.g., XAUUSD), and integrates concepts related to breakout strategies, trend indicators like Supertrend, and momentum measures such as RSI. It is intended to enhance market structure understanding and assist in decision-making by visually representing key imbalance zones on trading charts.