
S&R Structural ZigZag
指标
611 下载
版本 1.0, Jun 2025
Windows 版、Mac 版
5.0
评价:1
说明
Pinescriptlabs 商店指标: 🤖Pinescriptlabs 商店 cBots :(cBot)
价格行为 (新)
尾随智能算法(新)
带摆动的之字形支撑与阻力
1. 这个指标的作用是什么? ❓
🔍 检测价格摆动(高点与低点)
- 扫描最近的柱子(“分析深度”)以找到该范围内的最高/最低价格。
- 用百分比阈值(例如,相较于上一个摆动变化超过1%)验证摆动 → 标记新的 ✅ 摆动高点/低点。
- 减少噪音 ⚡:仅当分析周期的一半内没有更高高点/更低低点时确认摆动。
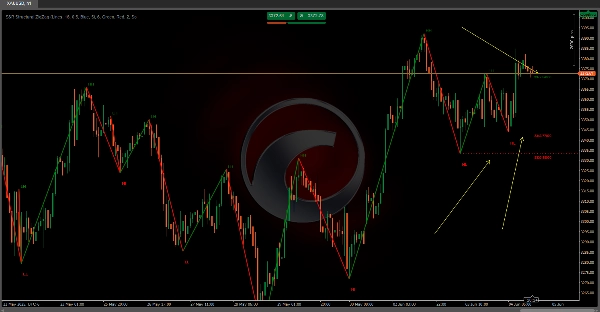
📉 绘制之字形趋势线
- 用动态线连接摆动:
-
- 🟢 绿色 = 上升趋势(新摆动 > 之前)。
- 🔴 红色 = 下降趋势(新摆动 < 之前)。
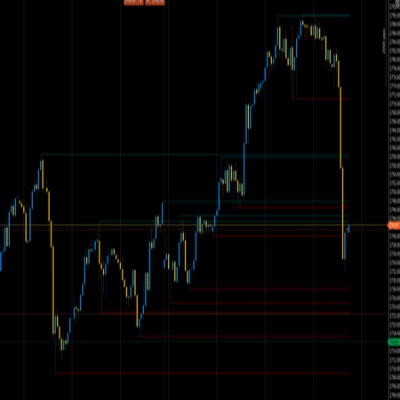
⏹️ 突出关键水平
- 支撑/阻力线:绘制于每个摆动的精确价格,向右延伸
- 标签显示价格值 📌 (例如,“1.1050”)以便即时分析。
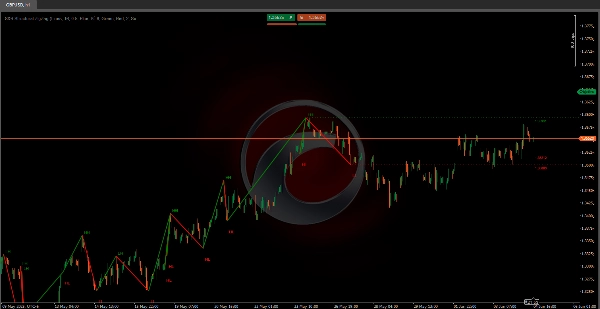
🚦 揭示市场结构
- 一目了然地识别趋势:
-
- 看涨 = 更高高点 (HH) + 更高低点 (HL)。
- 看跌 = 更低高点 (LH) + 更低低点 (LL)。
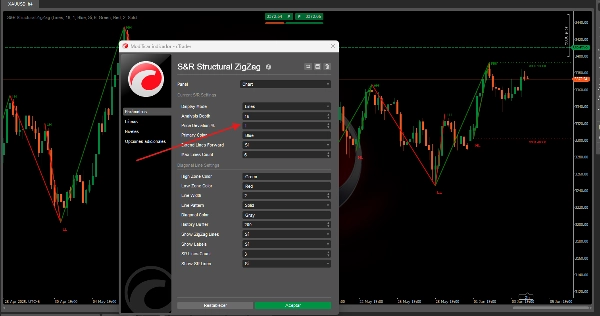
2. 如何使用(设置指南) ⚙️
安装到 cTrader:拖放到您的图表上!
关键设置:
- 分析深度 🔎:
10(默认)→ 较高数值过滤噪音;较低数值捕捉更多摆动。 - 价格偏差百分比 📏:
1.0%(可调节)→ 验证摆动的最小价格变动。 - 摆动标签 🏷️(HH/HL/LH/LL):开关切换。
- 延伸线条 ➡️:无限延伸支撑/阻力水平或限制于当前柱子。
摘要
AI 摘要
S&R Structural ZigZag is a technical indicator for cTrader that detects price swings by scanning recent bars to identify the highest and lowest prices within a specified analysis depth. It validates swings using an adjustable percentage threshold to mark significant swing highs and lows, reducing noise by confirming swings only if half the analysis period passes without a higher high or lower low. The indicator draws zigzag trendlines connecting these swings, using green lines to indicate uptrends (new swing higher than prior) and red lines for downtrends (new swing lower than prior). It highlights key support and resistance levels by drawing lines at each swing’s exact price and extending them rightward, with labels showing price values for quick reference. The tool also reveals market structure by identifying bullish trends (higher highs and higher lows) and bearish trends (lower highs and lower lows) at a glance. Key customizable settings include analysis depth, price deviation percentage, swing label toggling, and line extension options. Installation is straightforward via drag-and-drop onto charts in cTrader. This indicator supports analysis of various markets including cryptocurrencies (e.g., BTCUSD), commodities (e.g., XAUUSD), and others tagged for breakout and trend strategies.
指标配置
客户评价
5.0
评价:1
5 | 100 % | |
4 | 0 % | |
3 | 0 % | |
2 | 0 % | |
1 | 0 % |
客户评价
August 18, 2025
Clear structural support/resistance mapping, customizable, lightweight. Cons: No auto-labels, no historical level tracking, no alerts.
讨论
常见问答
BTCUSD
Breakout
Supertrend
Commodities
RSI
Crypto
XAUUSD
cTrader Store 提供的所有产品,包括交易机器人、指标和插件,均由第三方开发者提供,仅供信息参考和技术访问之用。cTrader Store 并非经纪商,不提供投资建议、个人推荐或任何未来业绩保证。


猜您喜欢


价格
注册日期 03/10/2024
163
销售
38.92K
免费安装