Descripción
Indicadores de Pinescriptlabs Store: 🤖Pinescriptlabs Store cBots : (cBot)
Gold & BTC BreakoutSession Pivots(nuevo)
SmartTrend Support &
Resistance
Lines
Dynamic
Market Structure
Analysis
of
Turning Points
Fibonacci
Linear
Regression
Multi-timeframe
Multi-Level
Candle Bias
Tracker
Auto
Support and
Resistance
Trend
Lines
All
Support and
Resistance
Levels
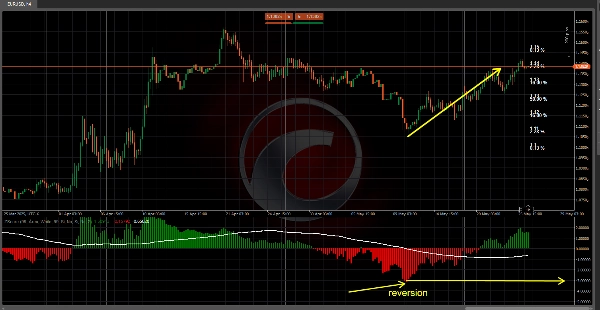
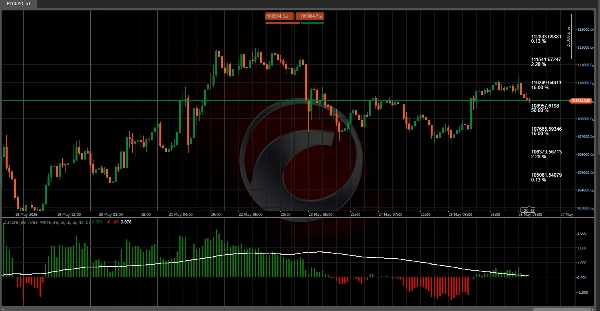
El Z-Score transforma el precio en una "escala de
desviación estándar",
mostrando qué tan lejos se desvía el cierre (o apertura, máximo, mínimo) de cada vela de su
media histórica. Con una visualización intuitiva, ayuda a identificar condiciones de sobrecompra/sobreventa
y zonas de reversión de alta probabilidad! 🔄
1️⃣ ¿Qué hace?
🔹 Estandariza el Precio: Convierte el valor absoluto de cierre en un Z-Score—cuántas desviaciones estándar está del promedio
de las últimas N barras.
🔹 Destaca
Extremos Estadísticos: Valores
cercanos a ±1, ±2, o ±3 indican rareza en el movimiento del precio:
- ±1 DE (≈ 68% de probabilidad entre –1 y 1)
- ±2 DE (≈ 95% de probabilidad entre –2 y 2)
- ±3 DE (≈ 99.7% de probabilidad entre –3 y 3)
🔹 Ayuda
en el trading de reversión a la media:
Cuando el Z-Score supera ±2 o ±3, el mercado está en una zona extrema
y tiende a revertir hacia la media (cero).
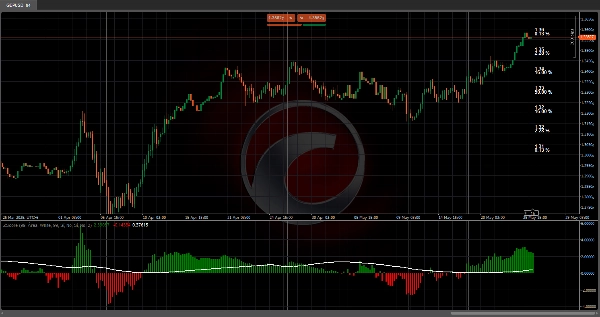
🔹 Visualización
Clara: Usando histogramas (o velas especiales), una línea de media móvil y zonas coloreadas, puedes ver instantáneamente si el precio se comporta "normalmente" o es un
valor atípico estadístico.
2️⃣ ¿Cómo funciona?
📐 Cálculo de la Media y Desviación Estándar
- Se usa un
periodo de retroceso (por ejemplo, 99
barras). - Se calculan la media y la desviación estándar (DE) de
los precios de cierre. - Mayor DE = Más volatilidad en los movimientos de precio.
🧮 Fórmula del Z-Score
Z=Close actual−Media históricaDesviación estándarZ=Desviación estándarClose actual−Media histórica
- Z positivo → Cierre por encima de la media.
- Z negativo → Cierre por debajo de la media.
📊 Probabilidades de la Tabla Z
- Resalta la
columna del Z-Score actual para mostrar qué tan raro/extremo es el precio!
3️⃣ Cómo usarlo en el trading
✅ Reversión a la media: Busca Z > +2 o Z < –2 para operar reversiones (vender extremos sobrecomprados, comprar extremos sobrevendidos).
✅ Confirmación de tendencia: Un Z sostenido
> 0 + media móvil ascendente señala
fortaleza; Z < 0 + media móvil descendente sugiere debilidad.
✅ Gestión de riesgo: Cerca de ±1 DE, espera movimientos normales; cerca de ±3
DE, ajusta stops y
tamaños de posición cuidadosamente.
✅ Momento de entrada: Combina Z-Scores extremos con niveles de soporte/resistencia
para entradas precisas.
4️⃣ Ventajas y consideraciones
✔️ Ventajas
- Ventaja estadística para detectar condiciones extremas de precio.
- Múltiples modos de visualización (histograma, velas, bandas, tabla de probabilidades).
- Fácil personalización (longitud, colores, tipo de gráfico).
⚠️ Consideraciones:
- En tendencias fuertes
, el precio puede mantenerse "extremo" durante largos períodos sin revertir. - Asume una
distribución normal—puede no funcionar bien en mercados altamente volátiles o sesgados. - Mejor usar en entornos de volatilidad
estables.
Resumen
The indicator calculates the mean and standard deviation of recent closing prices to determine the Z-Score using the formula:
Z = (Current Close − Historical Mean) / Standard Deviation.
Positive Z-Scores indicate prices above the mean, while negative scores indicate prices below it.
ZScore Reversion provides clear visualizations through histograms, special candles, moving averages, and colored zones to distinguish normal price behavior from statistical outliers. It supports mean reversion trading by signaling when prices exceed ±2 or ±3 standard deviations, suggesting a likely return to the mean. It also aids trend confirmation by interpreting sustained positive or negative Z-Scores combined with moving average trends.
Risk management is facilitated by adjusting stops and position sizes near extreme Z-Score values. Entry timing can be refined by combining extreme Z-Scores with support and resistance levels. The indicator offers multiple display modes and customization options for length, colors, and chart types. It is best suited for stable volatility environments and assumes a normal distribution of price data.
Valoraciones de clientes
5 | 100 % | |
4 | 0 % | |
3 | 0 % | |
2 | 0 % | |
1 | 0 % |