
Description
Indicateurs Pinescriptlabs Store: cBots Pinescriptlabs Store : (cBot) Gold & BTC BreakoutSession Pivots(nouveau)
PRICE ACTION (Nouveau)
Trailing Smart Algorithm (Nouveau)
Prédiction basée sur Linreg & ATR
SmartTrend Support &
Resistance
Lines
Analyse
Dynamique
de la Structure
du Marché
des
Points de retournement
Fibonacci
Régression
Linéraire
Multi-échelle
Gradient de Tendance Dynamique
Multi-niveaux
Suivi du biais
des chandeliers
Support et
Résistance
Automatiques
Lignes de tendance
Lignes
Tous
les supports et
résistances
Niveaux
Description :
Système de trading avancé HTF pour achat et vente
Qu’est-ce que c’est et à quoi ça sert ?
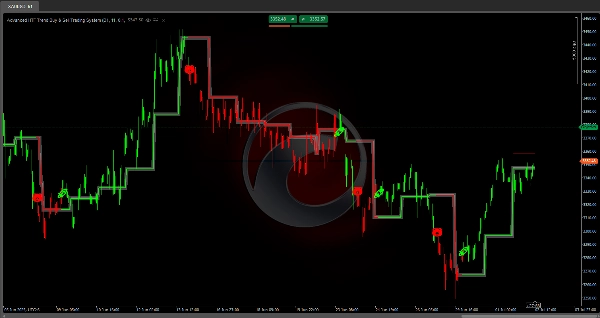
C’est un algorithme d’analyse technique qui identifie automatiquement les niveaux de support et de résistance 📈 basés sur les plages de prix historiques, et détecte quand le prix franchit ces niveaux pour générer des signaux de tendance 💡.
Comment fonctionne la logique ?
1️⃣ Calcul de la plage
L’indicateur analyse une période historique définie (entièrement configurable) pour trouver :
• Le prix le plus élevé atteint durant cette période 📊
• Le prix le plus bas atteint durant cette période 📉
• Le point médian entre ces deux niveaux ⚖️
2️⃣ Établissement des niveaux
Une fois les extrêmes identifiés, l’indicateur :
• Trace une ligne rouge au niveau maximum (résistance)
• Trace une ligne verte au niveau minimum (support)
• Ajoute une marge de sécurité à chaque niveau pour éviter les faux signaux 🛡️
3️⃣ Détection de cassure
Le système surveille constamment le prix pour détecter :
• Cassure haussière 🚀 : lorsque le prix clôture au-dessus du niveau de résistance + marge
• Cassure baissière 🐻 : lorsque le prix clôture en dessous du niveau de support - marge
4️⃣ Système de confirmation
Avant de générer un signal final ✅, l’indicateur :
• Attend un nombre configurable de barres consécutives confirmant la cassure ⏳
• Ce n’est qu’après confirmation qu’il change officiellement la tendance
5️⃣ Mise à jour dynamique
Les niveaux sont recalculés automatiquement :
• Lorsqu’une nouvelle période commence (quotidienne, hebdomadaire ou mensuelle, selon vos paramètres) 🔄
• Les lignes s’étendent jusqu’à ce que de nouveaux niveaux soient définis
• La ligne médiane change de couleur selon la tendance actuelle
Comment utiliser le ?
✨ Signaux :
• Acheter : Le symbole 🚀 apparaît lorsqu’une cassure haussière est confirmée
• Vendre : Le symbole 🐻 apparaît lorsqu’une cassure baissière est confirmée
🎨 Coloration des chandeliers :
• Les chandeliers sont automatiquement colorés selon la tendance actuelle :
✅ Vert : Tendance haussière active
❌ Rouge : Tendance baissière active
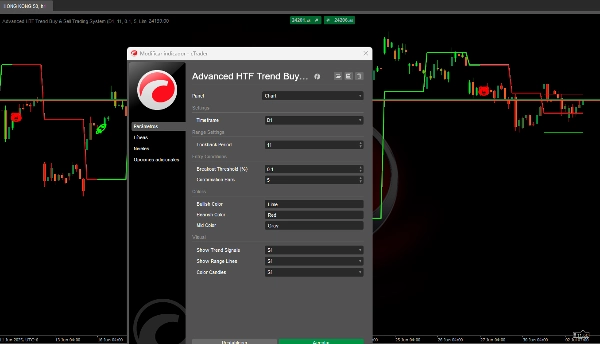
Paramètres
🔧 Période de retour (5–200, défaut : 11)
Que contrôle-t-il ?
Le nombre de barres historiques utilisées pour calculer les plus hauts et les plus bas.
Impact en cas de modification :
• Valeurs basses (5–15) :
- Des niveaux plus réactifs et fréquents
- Un nombre plus élevé de signaux
- Idéal pour le scalping et les trades à court terme
- Parfait pour les marchés très volatils
• Valeurs élevées (30–50) :
- Des niveaux plus stables et durables 🏛️
- Moins de signaux mais plus fiables
- Mieux adapté au swing trading et aux positions à moyen terme
- Idéal pour les marchés plus stables
📏 Seuil de cassure (0,01–5,0 %, défaut : 0,1 %)
Que contrôle-t-il ?
La marge supplémentaire que le prix doit dépasser pour confirmer une cassure.
Impact en cas de modification :
• Valeurs basses (0,05–0,15 %) :
- Signaux plus précoces et sensibles 🔍
- Risque plus élevé de fausses cassures
- Idéal pour les principales paires Forex avec faibles spreads
- Parfait pour les marchés à forte liquidité
• Valeurs élevées (0,3–1,0 %) :
- Signaux plus tardifs mais plus fiables 🛡️
- Risque réduit de bruit de marché
- Idéal pour les cryptomonnaies et actifs volatils
- Parfait pour les marchés avec spreads plus larges
⏳ Barres de confirmation (1–5, défaut : 1)
Que contrôle-t-il ?
Combien de barres consécutives doivent confirmer la cassure avant de générer un signal.
Impact en cas de modification :
• 1 barre :
- Signaux instantanés ⚡
- Plus d’opportunités de trading
- Risque accru de signaux prématurés
- Idéal pour les traders actifs
• 2–3 barres :
- Équilibre entre vitesse et fiabilité ⚖️
- Réduction significative des faux signaux
- Idéal pour la plupart des stratégies
• 4–5 barres :
- Signaux très conservateurs 🕊️
- Fiabilité maximale
- Peut manquer les opportunités précoces
- Idéal pour les positions à long terme
📊 Optimisation par type d’actif
💱 Forex Majors (EUR/USD, GBP/USD, etc.)
• Période de retour : 15–25
• Seuil : 0,05–0,15 %
• Confirmation : 1–2 barres
💰 Cryptomonnaies
• Période de retour : 10–20
• Seuil : 0,2–0,8 %
• Confirmation : 2–3 barres
📈 Indices boursiers
• Période de retour : 20–30
• Seuil : 0,1–0,3 %
• Confirmation : 1–2 barres
🌾 Matières premières
• Période de retour : 25–35
• Seuil : 0,15–0,4 %
• Confirmation : 2–3 barres
Considérations
• Peut générer des signaux tardifs dans des marchés très rapides 🏃♂️
• Moins efficace dans les marchés extrêmement latéraux
• Nécessite des ajustements de paramètres selon l’actif et l’échelle de temps ⏱️
Résumé
The system continuously monitors price action to detect bullish breakouts (price closing above resistance plus buffer) and bearish breakouts (price closing below support minus buffer). It includes a confirmation mechanism that waits for a configurable number of consecutive bars confirming the breakout before officially signaling a trend change. The midpoint line changes color to reflect the current trend, and all levels update dynamically at the start of new periods (daily, weekly, or monthly).
Signals are visually indicated with symbols: a rocket (🚀) for confirmed bullish breakouts and a bear (🐻) for confirmed bearish breakouts. Candles are colored green for active bullish trends and red for bearish trends.
Key adjustable parameters include lookback period (5–200 bars), breakout threshold buffer (0.01–5.0%), and confirmation bars (1–5). These settings can be optimized for various asset types such as Forex majors, cryptocurrencies, stock indices, and commodities, balancing signal frequency, reliability, and market conditions. The indicator supports multiple timeframes and is suitable for scalping, swing trading, and longer-term strategies depending on configuration.