Description
VERSION AMÉLIORÉE DISPONIBLE ICI
Vous cherchez plus que de simples superpositions de périodes natives ? L'indicateur Custom Timeframes étend ce concept avec des ajouts puissants :
- Périodes non standard (5H, 7H, 9H-23H, 25m, 35m, 50m, 55m, 4 jours, 2 semaines, 3 semaines, multi-mensuel, multi-annuel)
- Lignes OHLC avec contrôle du décalage des barres pour les barres complètes ou en formation
- Sept niveaux de Fibonacci (11,4 % à 88,6 %) avec mise en évidence de la zone d'équilibre
- Moyennes mobiles calculées directement sur la structure de la période personnalisée (9 types de MM, 8 sources de prix)
- Boutons bascule pour une gestion rapide des fonctionnalités.
Si vous avez besoin de périodes entre les intervalles standard du graphique avec une superposition complète d'analyse technique, consultez la version améliorée.
__________________________________________________________________________________________
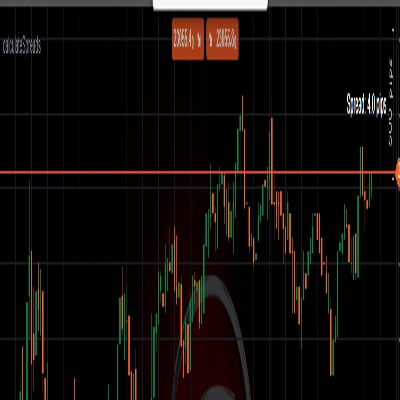
Superposez des chandeliers HTF en temps réel sur n'importe quel graphique sans changer de période.
Affiche la structure des chandeliers de période supérieure (corps et mèches) directement sur les graphiques de période inférieure avec des mises à jour en direct au fur et à mesure de la progression de la période.
Sélection flexible de la période (Journalier sur H1, Hebdomadaire sur H4, Mensuel sur Journalier), biais haussier/baissier codé par couleur (vert/rouge), style de ligne et transparence personnalisables, et performance légère offrent un contexte HTF continu pour les traders surveillant la structure sur plusieurs périodes sans changer de graphique.
FONCTIONNALITÉS
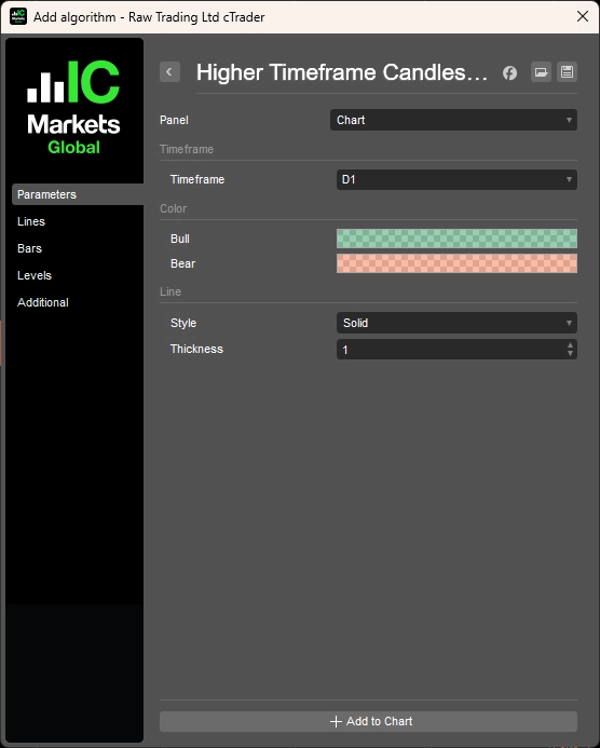
Sélection flexible de la période
- Toute HTF : Journalier sur H1, Hebdomadaire sur H4, Mensuel sur Journalier—votre choix
- Mises à jour en temps réel : redessin du chandelier HTF au fur et à mesure de la progression de la période
- Toujours visible : tradez sur des périodes inférieures tout en conservant le contexte de la période supérieure
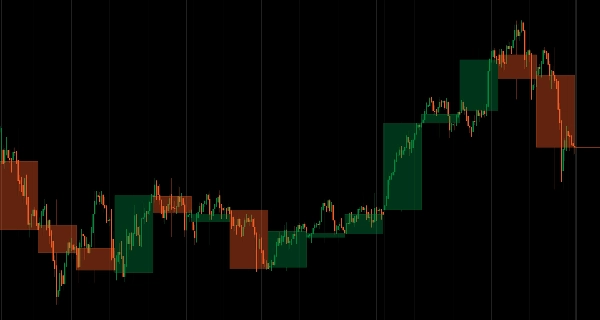
Clarté visuelle
- Codé par couleur : Haussier (vert), Baissier (rouge)—confirmation instantanée du biais
- Personnalisable : style de ligne, épaisseur, transparence
- Présentation claire : corps et mèches affichés distinctement
Intégration simple
- Aucun changement de période requis
- Conserve le contexte du graphique tout en affichant la structure HTF
- Léger et optimisé pour la performance
__________________________________________________________________________________________
PLUS D'INDICATEURS GRATUITS
Explorez une large gamme d'outils d'analyse de marché—de la structure et du volume à la régression, la volatilité et les périodes personnalisées.
Le code source est disponible sur le dépôt GitHub.
Tous gratuits à utiliser. Mais si vous souhaitez offrir un café en soutien, vous pouvez le faire ici.
Support/Résistance
Volume
- Volume Activity Profiler
- Volume Efficiency Analyzer
- Volume Profile Analytics
- Volume Profile - Updated
- Volume Spread Analysis
- VWAP (Volume Weighted Average Price)
Moyennes Mobiles
- Anchored Moving Average
- Deviation-Scaled Moving Average
- Instantaneous Trendline
- Kaufman Adaptive MA with Trend Vision
- Moving Average Channel
- Moving Averages Suite
- Trend Channel Moving Average
Utilitaires/Personnalisé
Basé sur la Régression
Volatilité
Oscillateurs
__________________________________________________________________________________________
AVERTISSEMENT
Le trading comporte des risques. Cet indicateur est destiné uniquement à l'analyse technique — appliquez toujours une gestion appropriée des risques et tradez de manière responsable.
RETROACTION & AMÉLIORATIONS
Si vous avez des suggestions, des demandes de fonctionnalités ou des idées d'amélioration, veuillez laisser un commentaire dans l'onglet Discussion. Vos retours aident à améliorer l'indicateur pour tous.