Deskripsi
RINGKASAN
Indikator Waddah Attar Explosion (WAE) dibuat oleh Ahmad Waddah Attar dan diperkenalkan ke komunitas trading pada tahun 2007. Ini menggabungkan pengukuran momentum MACD dengan analisis volatilitas Bollinger Bands untuk mengidentifikasi momen "ledakan harga"—periode ketika harga bertransisi dari konsolidasi ke pergerakan arah yang kuat.
Indikator ini menjawab dua pertanyaan:
- Apakah momentum sedang membangun? (diukur dengan laju perubahan MACD)
- Apakah volatilitas sedang berkembang? (diukur dengan lebar Bollinger Bands)
Ketika kedua kondisi tersebut sejajar di atas filter noise (Dead Zone), itu menandakan potensi pergerakan eksplosif.
KOMPONEN
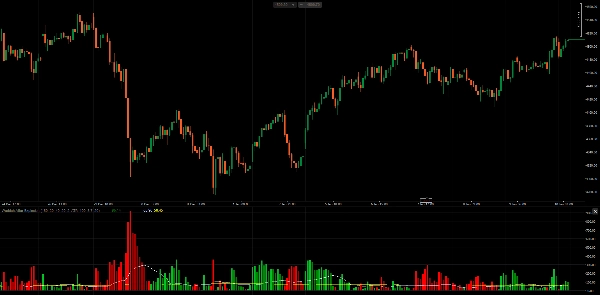
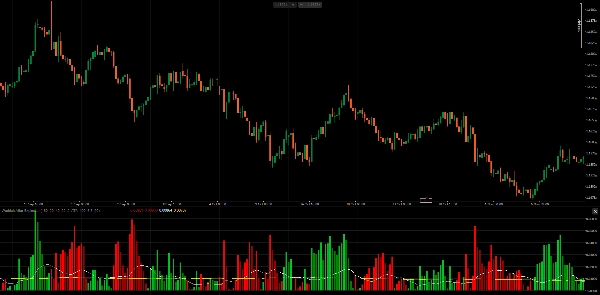
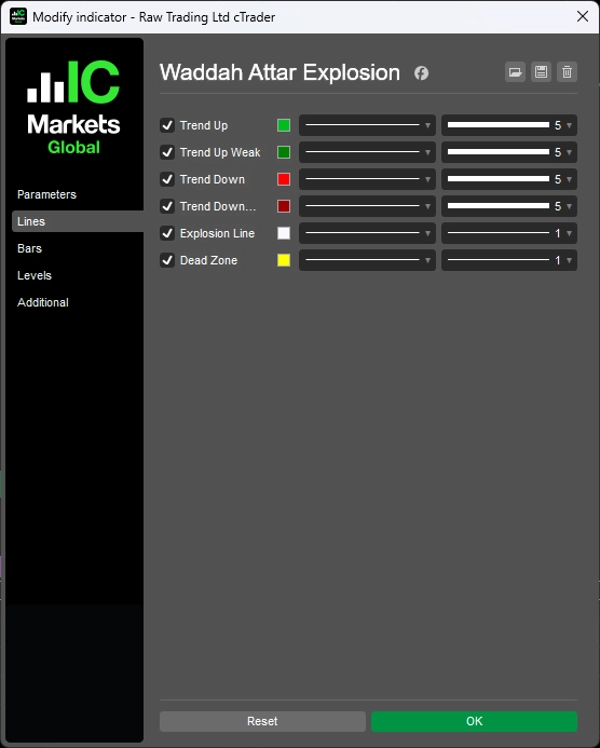
1. Histogram Tren (Hijau/Merah) Menampilkan laju perubahan garis MACD, dikalikan dengan faktor sensitivitas.
- Perhitungan:
(MACD_current - MACD_previous) × Sensitivity - Batang hijau: Momentum bullish (MACD mempercepat ke atas)
- Batang merah: Momentum bearish (MACD mempercepat ke bawah)
- Warna cerah: Momentum meningkat dibandingkan batang sebelumnya
- Warna gelap: Momentum menurun dibandingkan batang sebelumnya
2. Garis Ledakan (Putih) Mewakili lebar Bollinger Bands, menunjukkan perluasan atau kontraksi volatilitas.
- Perhitungan:
BB_Upper - BB_Lower - Naik: Volatilitas berkembang (potensi breakout)
- Turun: Volatilitas menyusut (konsolidasi)
3. Dead Zone (Kuning) Filter ambang untuk menghilangkan sinyal lemah yang disebabkan oleh noise pasar.
- Berbasis ATR: Menyesuaikan dengan volatilitas pasar saat ini
- Pips Tetap: Nilai ambang statis
CARA AHMAD WADDAH ATTAR MENGGUNAKANNYA
Menurut penulis asli:
Aturan Masuk untuk Beli Semua kondisi harus terpenuhi:
- Histogram hijau sedang naik
- Histogram hijau berada di atas Garis Ledakan
- Garis Ledakan sedang naik
- Baik histogram hijau maupun Garis Ledakan berada di atas Dead Zone
Aturan Masuk untuk Jual Semua kondisi harus terpenuhi:
- Histogram merah sedang naik
- Histogram merah berada di atas Garis Ledakan
- Garis Ledakan sedang naik
- Baik histogram merah maupun Garis Ledakan berada di atas Dead Zone
Aturan Keluar
- Keluar posisi long saat histogram hijau menembus ke bawah Garis Ledakan
- Keluar posisi short saat histogram merah menembus ke bawah Garis Ledakan
Wawasan Utama Sudut Garis Ledakan penting. Ketika Garis Ledakan miring ke atas dan histogram menembus di atasnya, ini mengonfirmasi bahwa volatilitas sedang meningkat secara aktif—"ledakan" itu nyata, bukan sinyal palsu.
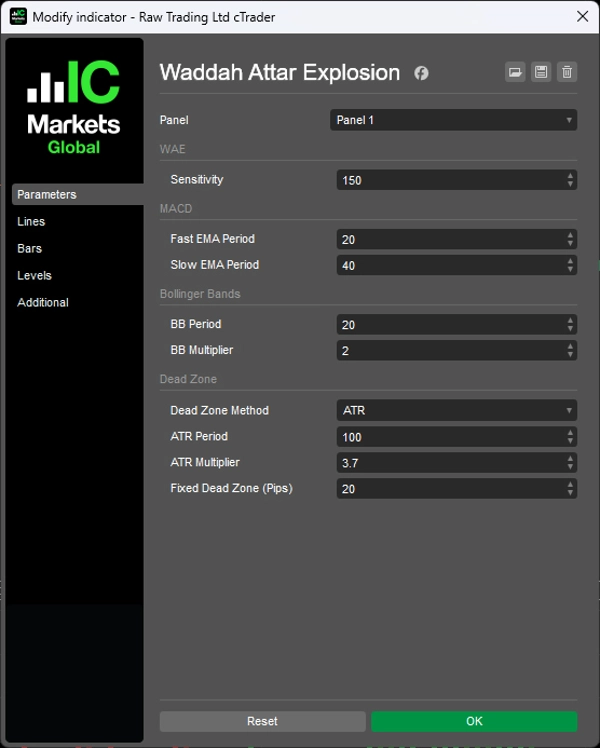
PARAMETER
1. Sensitivitas
- Sensitivitas (150): Pengali untuk laju perubahan MACD
2. MACD
- Periode EMA Cepat (20): Rata-rata bergerak cepat untuk perhitungan MACD
- Periode EMA Lambat (40): Rata-rata bergerak lambat untuk perhitungan MACD
3. Bollinger Bands
- Periode BB (20): Periode lookback Bollinger Bands
- Pengali BB (2.0): Pengali deviasi standar
4. Dead Zone
- Metode Dead Zone (ATR): Pilih antara berbasis ATR atau Pips Tetap
- Periode ATR (100): Periode untuk perhitungan ATR
- Pengali ATR (3.7): Pengali yang diterapkan pada ATR untuk Dead Zone
- Dead Zone Tetap (20): Nilai Dead Zone dalam pips (saat menggunakan metode Tetap)
CATATAN
- Indikator ini bekerja pada semua kerangka waktu. Penulis asli merekomendasikan H1 dan M30.
- Dead Zone berbasis ATR direkomendasikan karena menyesuaikan dengan instrumen dan kondisi pasar yang berbeda.
- Parameter Sensitivitas mungkin perlu disesuaikan berdasarkan kerangka waktu dan volatilitas instrumen.
- Indikator ini mengidentifikasi keselarasan momentum dan volatilitas—tidak memprediksi arah secara sendiri. Pertimbangkan menggunakannya bersama analisis tren atau level support/resistance.
__________________________________________________________________________________________
INDIKATOR GRATIS LAINNYA
Jelajahi berbagai alat analisis pasar—dari struktur dan volume hingga regresi, volatilitas, dan kerangka waktu kustom.
Kode sumber tersedia di GitHub repository.
Semua gratis untuk digunakan. Tetapi jika Anda ingin memberikan dukungan kopi, Anda dapat mengarahkannya di sini.
Support/Resistance
Volume
- Volume Activity Profiler
- Volume Efficiency Analyzer
- Volume Profile Analytics
- Volume Profile - Updated
- Volume Spread Analysis
- VWAP (Volume Weighted Average Price)
Moving Averages
- SSL Channel
- Anchored Moving Average
- Deviation-Scaled Moving Average
- Gann High Low Activator
- Instantaneous Trendline
- Kaufman Adaptive MA with Trend Vision
- Moving Average Channel
- Moving Averages Suite
- Trend Channel Moving Average
Utilities/Custom
Regression-Based
Volatility
Oscillators
__________________________________________________________________________________________
PENAFIAN
Perdagangan melibatkan risiko. Indikator ini dimaksudkan hanya untuk analisis teknikal — selalu terapkan manajemen risiko yang tepat dan berdagang dengan bertanggung jawab.
MASUKAN & PENINGKATAN
Jika Anda memiliki saran, permintaan fitur, atau ide untuk peningkatan, silakan tinggalkan komentar di tab Diskusi. Masukan Anda membantu meningkatkan indikator untuk semua orang.