Deskripsi
RINGKASAN
Indikator ini mengimplementasikan metodologi "Identifikasi Tren Dengan Penyaringan Harga dan Waktu" oleh Alfred François Tagher, yang diterbitkan dalam edisi Februari 2024 majalah Technical Analysis of Stocks & Commodities.
Konsep ini menggabungkan aksi harga dengan penyaringan berbasis waktu untuk mengurangi noise pasar dan mengidentifikasi tren yang berkelanjutan. Alih-alih bereaksi terhadap setiap pergerakan harga, indikator hanya mengubah arah tren ketika harga ditutup di luar rentang periode sebelumnya—kondisi yang menandakan momentum nyata daripada fluktuasi acak.
ATURAN INTI
Aturan asli sangat sederhana:
- Jika penutupan periode melebihi harga tertinggi periode sebelumnya → tren adalah NAIK
- Jika penutupan periode berada di bawah harga terendah periode sebelumnya → tren adalah TURUN
- Tren tetap tidak berubah sampai terjadi kondisi pembalikan
Pendekatan ini menyaring pergerakan harga kecil yang tetap berada dalam rentang periode sebelumnya, hanya fokus pada breakout yang menunjukkan komitmen.
CARA KERJANYA
Indikator membandingkan penutupan timeframe saat ini dengan harga tertinggi dan terendah periode sebelumnya dari timeframe yang lebih tinggi yang dipilih:
- Tren Naik: Penutupan saat ini > Harga tertinggi periode sebelumnya
- Tren Turun: Penutupan saat ini < Harga terendah periode sebelumnya
- Tidak Ada Perubahan: Penutupan tetap dalam rentang periode sebelumnya
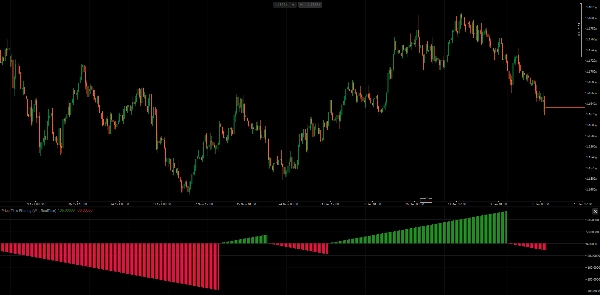
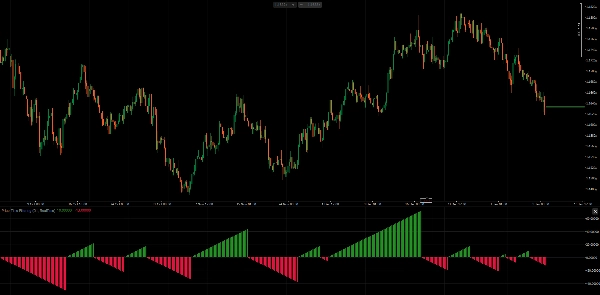
Histogram menampilkan hitungan berjalan dari bar dalam arah tren saat ini—nilai positif untuk tren naik, nilai negatif untuk tren turun. Ini memvisualisasikan arah dan durasi tren.
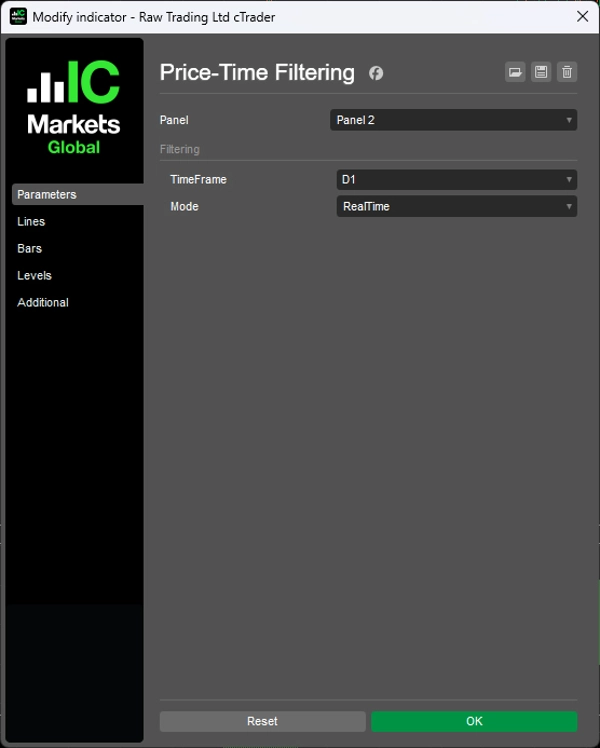
MODE PENYARINGAN
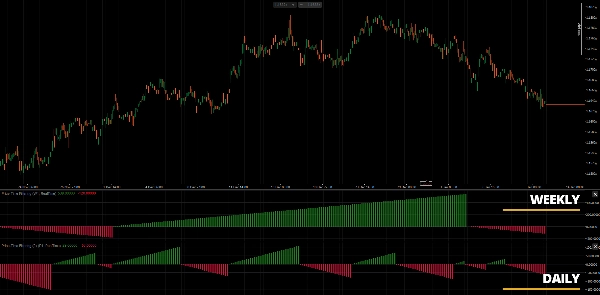
1. Mode PeriodEnd Mengevaluasi tren hanya ketika periode timeframe yang lebih tinggi selesai. Ini sesuai dengan metodologi asli di mana tren mingguan ditentukan oleh penutupan hari Jumat (atau penutupan akhir bulan untuk bulanan). Lebih stabil, sinyal lebih sedikit.
2. Mode RealTime Mengevaluasi tren pada setiap bar menggunakan penutupan saat ini terhadap rentang periode sebelumnya. Memberikan sinyal lebih awal tetapi mungkin menghasilkan lebih banyak noise selama periode tersebut.
PARAMETER
- TimeFrame: Timeframe yang lebih tinggi untuk evaluasi tren (misalnya, Mingguan, Bulanan)
- Mode: PeriodEnd (metodologi asli) atau RealTime (varian responsif)
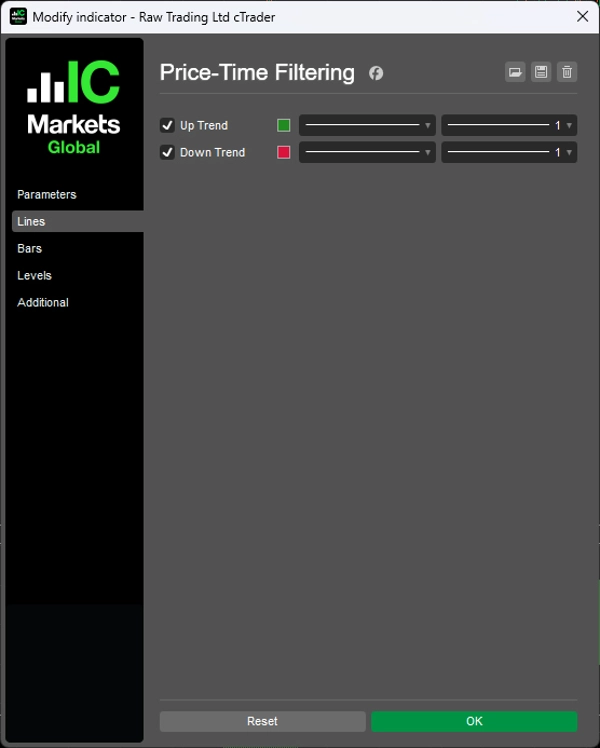
INTERPRETASI
- Histogram hijau: Tren naik sedang berlangsung, hitungan bar menunjukkan durasi
- Histogram merah: Tren turun sedang berlangsung, hitungan bar menunjukkan durasi
- Reset histogram: Terjadi pembalikan tren
Indikator bekerja paling baik pada grafik harian dengan pemilihan timeframe Mingguan atau Bulanan, seperti yang dijelaskan dalam artikel asli. Namun, implementasi mendukung kombinasi timeframe apa pun.
CATATAN
- Awalnya dirancang untuk grafik harian dengan evaluasi mingguan/bulanan
- Bekerja pada kombinasi timeframe apa pun di mana timeframe yang dipilih lebih tinggi dari timeframe grafik
- Hitungan bar memberikan ukuran kematangan tren—hitungan lebih panjang menunjukkan tren yang sudah mapan
- Pertimbangkan menggabungkan dengan analisis struktur harga untuk timing masuk
REFERENSI
Tagher, Alfred François. "Trend Identification By Price And Time Filtering." Technical Analysis of Stocks & Commodities, Februari 2024.
__________________________________________________________________________________________
INDIKATOR GRATIS LAINNYA
Jelajahi berbagai alat analisis pasar—dari struktur dan volume hingga regresi, volatilitas, dan timeframe khusus.
Kode sumber tersedia di repository GitHub.
Semua gratis untuk digunakan. Tetapi jika Anda ingin mengirim dukungan kopi, Anda dapat mengarahkannya di sini.
Support/Resistance
Volume
- Volume Activity Profiler
- Volume Efficiency Analyzer
- Volume Profile Analytics
- Volume Profile - Updated
- Volume Spread Analysis
- VWAP (Volume Weighted Average Price)
Moving Averages
- SSL Channel
- Anchored Moving Average
- Deviation-Scaled Moving Average
- Gann High Low Activator
- Instantaneous Trendline
- Kaufman Adaptive MA with Trend Vision
- Moving Average Channel
- Moving Averages Suite
- Trend Channel Moving Average
Utilities/Custom
Regression-Based
Volatility
Oscillators
__________________________________________________________________________________________
PENAFIAN
Perdagangan melibatkan risiko. Indikator ini dimaksudkan hanya untuk analisis teknikal — selalu terapkan manajemen risiko yang tepat dan berdaganglah dengan bertanggung jawab.
MASUKAN & PENINGKATAN
Jika Anda memiliki saran, permintaan fitur, atau ide untuk peningkatan, silakan tinggalkan komentar di tab Diskusi. Masukan Anda membantu meningkatkan indikator untuk semua orang.
Ringkasan
The indicator supports two filtering modes: PeriodEnd mode, which evaluates trends only at the close of a higher timeframe period (e.g., weekly or monthly), providing more stable signals; and RealTime mode, which updates trend status on every bar for more responsive but potentially noisier signals. Users can select the higher timeframe for trend evaluation, typically weekly or monthly, while applying the indicator on lower timeframe charts.
A histogram visually represents trend direction and duration, with positive values and green bars indicating uptrends, negative values and red bars indicating downtrends, and resets marking trend reversals. The indicator is applicable across various markets including Forex, indices, commodities, crypto, and stocks, and supports any timeframe combination where the selected higher timeframe exceeds the chart timeframe.