Descrição
Indicadores da loja Pinescriptlabs: cBots da loja Pinescriptlabs : (cBot) Gold & BTC BreakoutSession Pivots(novo)
Projeção de Liquidez de Preço ZigZag
Algoritmo Inteligente de Trailing (novo)
Mapa de Liquidação de Alavancagem
Previsão Baseada em Linreg & ATR
Suporte & SmartTrend
Resistência
Linhas
Sistema de Rompimento de Canal
Análise
Dinâmica da Estrutura
de Mercado
de
Pontos
de Virada
Regressão
Linear
Fibonacci
Multi-temporal
Gap de Valor Justo de Momentum
Gradiente de Tendência Dinâmica
Viés de
Velas Multi-Nível
Rastreador
Rastreador de Extremos Zig-Zag
Suporte
e Resistência
Automáticos
de Tendência
Linhas
Todos
os Suportes e
Resistências
Níveis
📊 Projeção de Fluxo de Mercado:
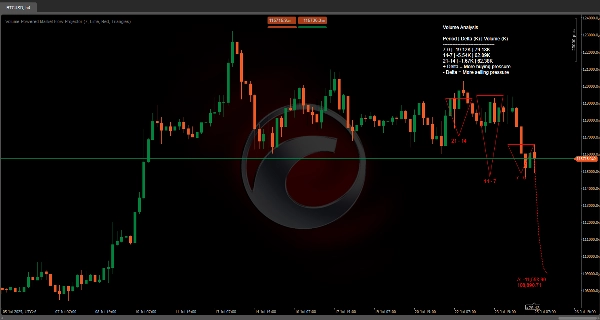
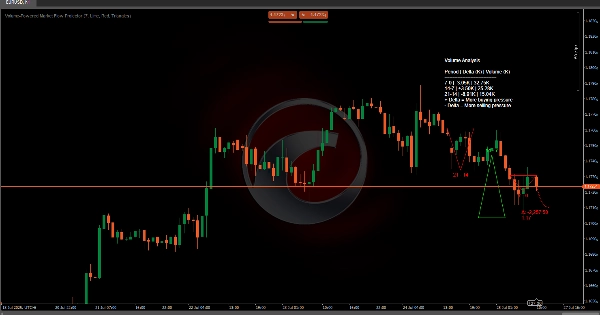
O FutureTrend é um indicador projetado para analisar e projetar dinamicamente o comportamento do mercado integrando dados de preço e volume em múltiplas dimensões temporais. Suas funcionalidades principais incluem:
⏳ Análise de Três Períodos
📈 Calcula os preços médios (máximos e mínimos) e o volume delta (diferença entre pressão de compra e venda) em três períodos consecutivos definidos pelo parâmetro Period.
🔍 Esta visão consolidada dos movimentos históricos ajuda a identificar tendências dominantes e mudanças no comportamento do mercado.
🚀 Projeção da Linha de Tendência Futura
📊 Usando uma média ponderada dos volumes delta dos três períodos analisados, o indicador projeta uma linha de tendência futura que reflete a possível direção do mercado.
🛠️ A projeção ajusta-se dinamicamente usando fatores de suavização para evitar previsões extremas.
🔷 Representação Visual de Formas
🎨 Dados históricos são representados visualmente por meio de formas geométricas (triângulos, círculos ou caixas) que ilustram a evolução dos volumes e faixas de preço para cada período.
🔴🟢 As cores atribuídas (UpColor e DownColor) indicam a tendência predominante (altista ou baixista), permitindo uma interpretação rápida.
🏷️ Volume Delta Médio & Rótulo de Preço Futuro
📍 No final da linha de tendência projetada, um rótulo exibe o volume delta médio e o preço futuro estimado, oferecendo uma referência chave para potenciais movimentos de preço e força da tendência.
📋 Tabela de Dados de Volume
📑 Fornece uma tabela detalhada que divide os volumes totais e as diferenças delta para os três períodos analisados.
📊 Isso permite que os traders comparem rapidamente os dados de volume, interpretem o contexto do mercado e apoiem a projeção da tendência futura.
🔮 Direção
Ao combinar volume e dados de preço, o indicador oferece uma ferramenta robusta para prever tanto a força da tendência quanto potenciais mudanças no comportamento do mercado durante os períodos futuros.
Resumo
The indicator projects a future trendline based on a weighted average of delta volumes from the analyzed periods, dynamically adjusted with smoothing factors to prevent extreme predictions. Historical data is visually represented using geometric shapes—such as triangles, circles, or boxes—that illustrate volume and price range evolution for each period. Colors indicate prevailing trends, with distinct hues for bullish and bearish conditions.
At the end of the projected trendline, a label displays the average delta volume and estimated future price, providing a reference for potential price movements and trend strength. Additionally, a detailed volume data table breaks down total volumes and delta differences for the three periods, supporting market context interpretation and trend projection. By combining volume and price data, this tool aids in predicting trend strength and potential market behavior shifts.
Avaliações de clientes
5 | 100 % | |
4 | 0 % | |
3 | 0 % | |
2 | 0 % | |
1 | 0 % |