
Prime Trend Targets
지표
333 다운로드
버전 1.0, Jun 2025
Windows, Mac
4.0
리뷰: 1
설명
설명
Pinescriptlabs 스토어 지표: 🤖 Pinescriptlabs 스토어 cBots : (cBot)
Gold & BTC Breakout세션 피벗(new)
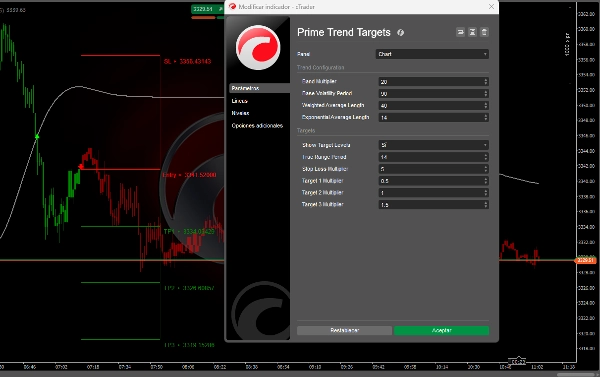
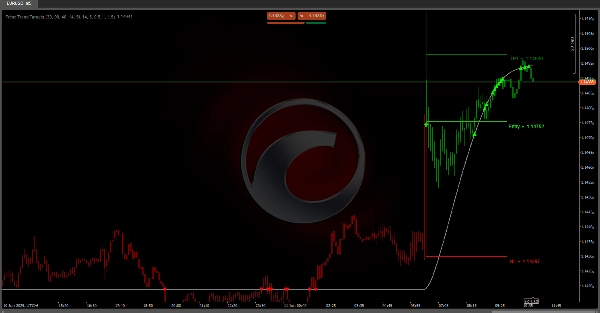
프라임 트렌드 타겟 :
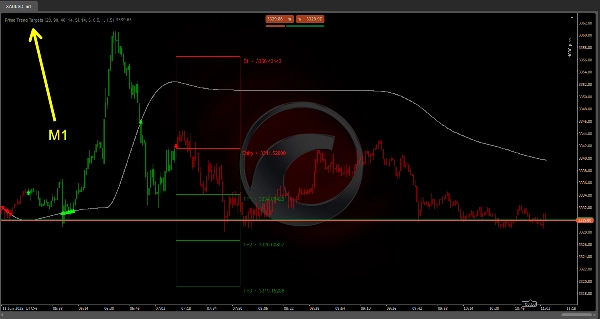
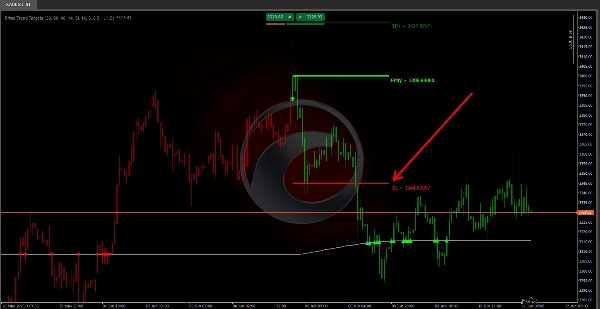
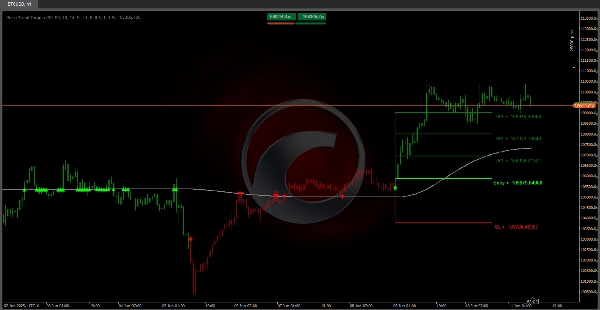
제공하는 부드러운 추세선 은 변동성 밴드(ATR) 를 기반으로 하며, 지속성 로직을 통해 작은 잡음을 걸러냅니다. 🔄 현재 라인의 값과 이전 값을 비교하여 추세 반전 을 감지하고, 가격이 라인을 반복적으로 테스트할 때 거부 횟수 를 통해 신호를 검증합니다. ✅ 단계 전환이 확인되면, 진입, 손절, 그리고 최대 세 개의 변동성 조정 목표(ATR × 배수)를 예측하며, 차트에 위험/보상 레벨과 구역을 표시합니다. 🎨 캔들은 단계를 쉽게 읽을 수 있도록 색칠됩니다.
⚙️ 파라미터 영향
• 민감도와 견고성의 균형:
- 📉 짧은 ATR 및 평활 기간 은 반전에 더 빠르게 반응하지만 잡음이 더 많습니다.
- 📊 긴 기간 은 거짓 신호를 완화하지만 감지가 지연될 수 있습니다.
- 🔍 큰 배수 는 밴드와 스톱을 넓혀 조기 신호를 줄이지만, 예상 반전이 실패할 경우 지연이나 손실이 증가할 수 있습니다.
- 🎯 작은 목표 는 적당한 이익을 빠르게 확보하며; 큰 목표 는 확장된 움직임을 노리지만 적중 확률은 낮습니다.
• 전체적 조정: 자산 및 시간대에 맞게 변동성, 밴드, 평활, 레벨 관리 설정을 조합하세요.
✅운영 지침
• 백테스트 및 데모 테스트 를 철저히 수행하세요—다양한 조건(추세, 횡보, 고/저 변동성)에서 여러 조합을 시도해 보세요.
• 다른 분석과 결합: 서포트/저항, 캔들스틱 패턴, 거래량 또는 확인 지표와 함께 사용하세요.
• 위험 관리: 손절 거리 기준으로 포지션 크기를 조절하여 고정 위험 비율을 유지하세요.
• 규율 및 주기적 검토: 과거 데이터에 과도하게 최적화하지 말고, 시장 상황 변화 시 조정하세요.
요약
AI 요약
Prime Trend Targets is a technical indicator designed for trading platforms that provides a smoothed trendline based on volatility bands derived from the Average True Range (ATR). It incorporates persistence logic to filter out minor market noise and detects trend reversals by comparing the current trendline value with its previous value. The indicator validates reversal signals through a rejection count mechanism, which tracks repeated price tests of the trendline.
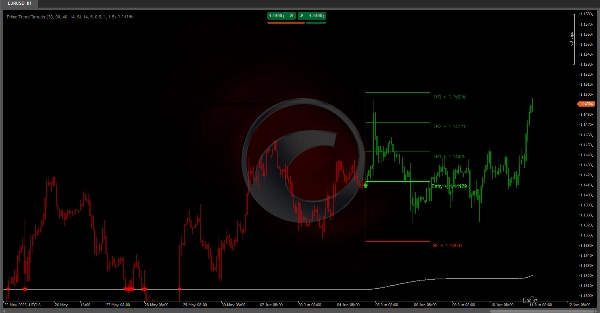
Upon confirming a phase shift, Prime Trend Targets projects key trading levels including entry points, stop loss, and up to three volatility-adjusted targets calculated as ATR multiplied by configurable multipliers. These levels are visually represented on the chart as risk/reward zones. Additionally, the indicator colors candles according to the current market phase for easier interpretation.
Users can adjust parameters to balance sensitivity and robustness: shorter ATR and smoothing periods increase responsiveness but may generate more noise, while longer periods reduce false signals but delay detection. Larger multipliers widen bands and stops, reducing premature signals but potentially increasing lag or losses if reversals fail. Target sizes can be set smaller for quicker gains or larger for extended moves with lower hit probability.
The indicator supports holistic tuning by combining volatility, band, smoothing, and level management settings tailored to specific assets and timeframes. Operational guidelines recommend thorough backtesting, combining with other analysis tools, applying risk management, and maintaining discipline with periodic reviews.
지표 프로필
고객 리뷰
4.0
리뷰: 1
5 | 0 % | |
4 | 100 % | |
3 | 0 % | |
2 | 0 % | |
1 | 0 % |
고객 리뷰
October 19, 2025
Appreciate all your helpful contributions to the Ctrader community, I know you want us to win :). Helpful indicator for anybody... If you could fix this in the future updates so the candles can be toggled back to their regular color, it would be much better. Currently it screws the chart up and won't refresh.
상담
자주 묻는 질문(FAQ)
BTCUSD
Breakout
Supertrend
Commodities
RSI
Crypto
XAUUSD
ATR
트레이딩 봇, 지표, 플러그인 등 cTrader Store에서 제공되는 상품은 제3자 개발자에 의해 제공되며, 이는 단순히 정보 및 기술적 접근을 목적으로 제공된 것입니다. cTrader Store는 중개인이 아니며, 투자 조언, 개인별 추천 또는 향후 성과에 대한 어떠한 보장도 제공하지 않습니다.


가격
가입일 03/10/2024
163
판매
38.56K
무료 설치