
Penerangan
Penunjuk Kedai Pinescriptlabs: 🤖Pinescriptlabs Kedai cBots : (cBot)
PRICE ACTION (Baru)
Gold & BTC BreakoutSession Pivots(baru)
Trailing Smart Algorithm(Baru)
SmartTrend Support &
Resistance
Lines
Dynamic
Market Structure
Analysis
of
Turning Points
Fibonacci
Linear
Regression
Multi-timeframe
Multi-Level
Candle Bias
Tracker
Auto
Support and
Resistance
Trend
Lines
All
Support and
Resistance
Levels
Zig Zag Support & Resistance with Swings
1. Apa Yang Penunjuk Ini Lakukan? ❓
🔍 Mengesan Ayunan Harga (Tinggi & Rendah)
- Mengimbas bar terkini ("Kedalaman Analisis") untuk mencari harga tertinggi/terendah dalam julat itu.
- Mengesahkan ayunan dengan ambang % (contoh, perubahan 1%+ berbanding ayunan terakhir) → Menandakan baru ✅ Ayunan Tinggi/Rendah.
- Mengurangkan bunyi ⚡: Hanya mengesahkan ayunan jika separuh tempoh analisis berlalu tanpa tinggi lebih tinggi/rendah lebih rendah.
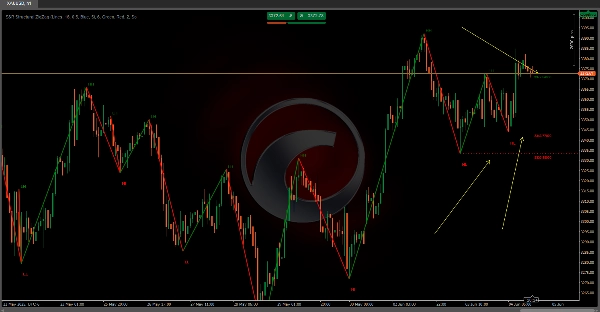
📉 Melukis Garis Tren Zigzag
- Menyambungkan ayunan dengan garis dinamik:
-
- 🟢 Hijau = Tren Naik (ayunan baru > sebelumnya).
- 🔴 Merah = Tren Turun (ayunan baru < sebelumnya).
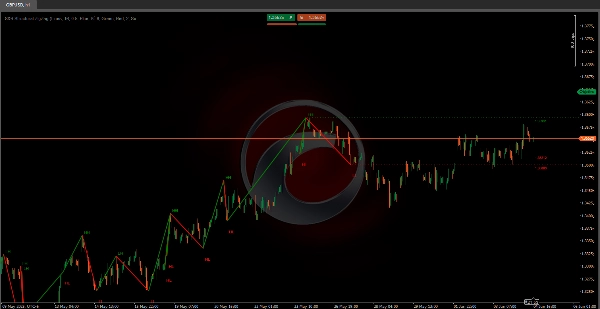
⏹️ Menonjolkan Tahap Utama
- Garis Sokongan/Perlawanan: Dilukis pada harga tepat setiap ayunan, dilanjutkan ke kanan
- Label menunjukkan nilai harga 📌 (contoh, "1.1050") untuk analisis segera.
🚦 Mendedahkan Struktur Pasaran
- Mengenal pasti tren dengan pantas:
-
- Bullish = Tinggi Lebih Tinggi (HH) + Rendah Lebih Tinggi (HL).
- Bearish = Tinggi Lebih Rendah (LH) + Rendah Lebih Rendah (LL).
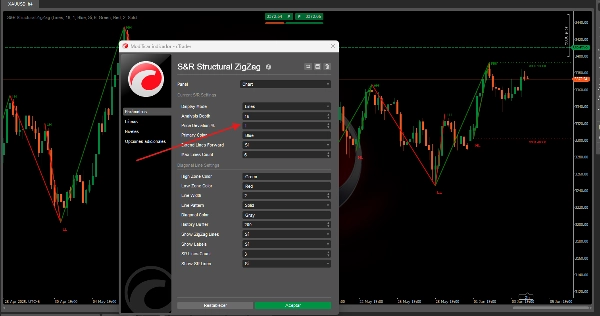
2. Cara Menggunakannya (Panduan Persediaan) ⚙️
Pasang pada cTrader: Seret & lepaskan ke carta anda!
Tetapan Utama:
- Kedalaman Analisis 🔎:
10(lalai) → Nilai lebih tinggi menapis bunyi; nilai lebih rendah menangkap lebih banyak ayunan. - Peratusan Penyimpangan Harga 📏:
1.0%(boleh laras) → Perubahan harga minimum untuk mengesahkan ayunan. - Label Ayunan 🏷️ (HH/HL/LH/LL): Hidupkan/Mati.
- Lanjutkan Garis ➡️: Projek tahap S/R tanpa had atau hadkan pada bar semasa.
Ringkasan
Ulasan pelanggan
5 | 100 % | |
4 | 0 % | |
3 | 0 % | |
2 | 0 % | |
1 | 0 % |


