„Prime Trend Targets“-Logo
Prime Trend Targets
4.0
Bewertungen: 1
In „Prime Trend Targets“ hochgeladenes Bild
Seit 03/10/2024
143
Verkäufe
32.29K
Kostenlose Installationen

Description

Pinescriptlabs Store indicators:                        🤖 Pinescriptlabs  Store cBots : (cBot)
Gold & BTC BreakoutSession Pivots(new)

Auto-Trend Channel

PREMIUM SSL CHANNEL

ZigZag

 ICT Power of 3 
                                                   

SmartTrend Support &
Resistance
Lines
       

Fair Value Gap Sessions                
       

 BOS & CHOCH

RSI Trend Trigger

Channel Breakout System

Supertrend

Market Imbalance

Adaptive Trend Channel 

Dynamic
Market Structure
Analysis
of
Turning Points

Order Block

Fibonacci
Linear
Regression
Multi-timeframe

Volume POC Heatmap

Dynamic RSI

Momentum Fair Value Gap

Market Flow Projection

Dynamic Trend Gradient

Multi-Level
Candle Bias
Tracker

Zig-Zag Extremity Tracker

Reactive Moving Average

Auto
Support and
Resistance
Trend
Lines

All
Support and
Resistance
Levels

Leverage Liquidation Map

Zones Supply Demand

Dynamic Range Momentum


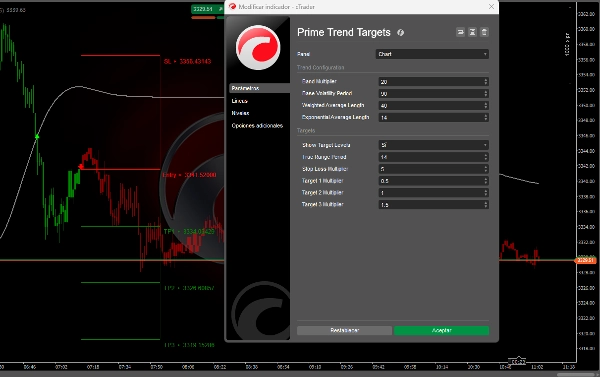
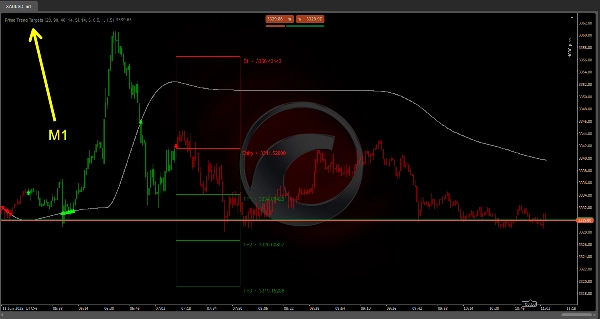
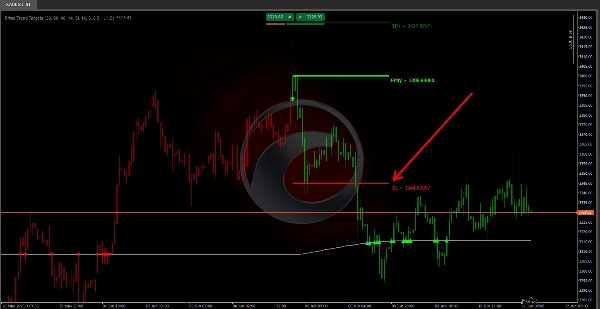
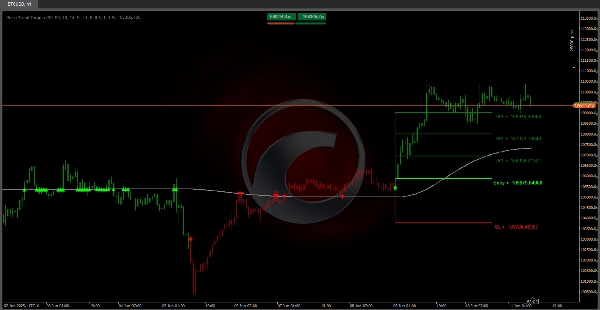
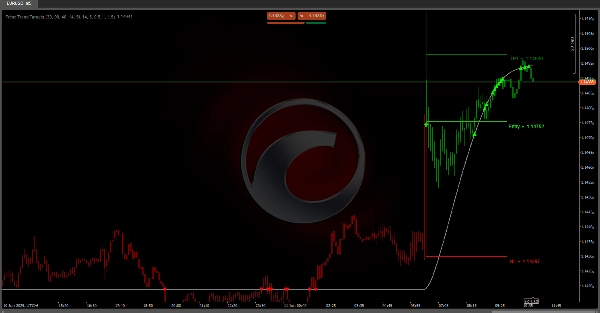
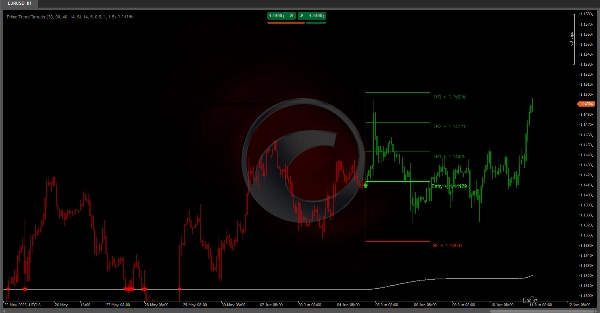
Prime Trend Targets :

offers a smoothed trendline based on volatility bands (ATR) with persistence logic, filtering out minor noise. 🔄 It detects trend reversals by comparing the current value of the line with the previous one and validates signals through a rejection count when price repeatedly tests the line. ✅ Once a phase shift is confirmed, it projects entry, stop loss, and up to three volatility-adjusted targets (ATR × multipliers), drawing risk/reward levels and zones on the chart. 🎨 Candles are colored by phase for easy reading.

⚙️ Parameter Impact

• Higher sensitivity vs. robustness:

  • 📉 Shorter ATR & smoothing periods react faster to reversals but generate more noise.
  • 📊 Longer periods smooth out false signals but may delay detection.
  • 🔍 Larger multipliers widen bands & stops, reducing premature signals but increasing lag or losses if the expected reversal fails.
  • 🎯 Smaller targets lock in moderate gains quickly; larger targets aim for extended moves but with lower hit probability.

• Holistic tuning: Combine volatility, band, smoothing, and level management settings for your asset & timeframe.

Operational Guidelines


•  Backtest & demo-test thoroughly—try different combos under varied conditions (trending, ranging, high/low volatility).
•  Combine with other analysis: Support/resistance, candlestick patterns, volume, or confirming indicators.
•  Risk management: Size positions based on stop distance to maintain a fixed risk percentage.
•  Discipline & periodic review: Avoid over-optimizing for past data; adjust when market conditions shift.

Indicator profile
4.0
Bewertungen: 1
5
0 %
4
100 %
3
0 %
2
0 %
1
0 %
Kundenbewertungen
October 19, 2025
Appreciate all your helpful contributions to the Ctrader community, I know you want us to win :). Helpful indicator for anybody... If you could fix this in the future updates so the candles can be toggled back to their regular color, it would be much better. Currently it screws the chart up and won't refresh.
BTCUSD
Breakout
RSI
ATR
Commodities
Supertrend
Crypto
XAUUSD
Products available through cTrader Store, including trading bots, indicators and plugins, are provided by third-party developers and made available for informational and technical access purposes only. cTrader Store is not a broker and does not provide investment advice, personal recommendations or any guarantee of future performance.

Mehr von diesem Autor

ZigZag filters noise, spots trends, patterns, pivots, aiding analysis, trade management, and confirmations. 📉📈
Identify bullish and bearish Order Blocks to spot key support/resistance levels and potential trend reversals! 📈🔄
📊 Shows volume by price levels, highlights POC, and key zones. Identifies dynamic support/resistance and imbalances.
Market structural patterns , specifically the concepts of Change of Character (ChoCH) 🔄 and Break of Structure (BoS) 💥
Adaptive trend channel using linear regression and Pearson correlation for dynamic support, resistance, and trends.
"Identify key market zones and visualize support/resistance from multiple timeframes on a single chart.
📊Zones Supply & Demand: Identifies key price levels with high volume concentration, marking Supply/Demand Zones & Marke
💹 Define a price channel 📈 and determine trend direction (bullish 🟢 or bearish 🔴).
identify and highlight temporary market inefficiencies known as "fair value gaps" 🚨 within specific trading Sessions.
Identify market structure effortlessly with swing highs, lows, CHoCH, and BOS levels for smart trading decisions! 📊🔍"
Detects bullish and bearish divergences
Advanced price action tool that combines multiple technical analysis concepts

Das könnte Sie auch noch interessieren

Combines SMA with dynamic correlation to adapt to market trends. Adjusts sensitivity, filters noise🚀📉
Non-repainting Fractal + ZigZag indicator with smart filtering. True market structure. No future function, no drift.
Average price calculator for multi-position management. Real-time break-even level with smart visuals.
Candlestick Signal Finder: cTrader indicator that automatically detects and color-codes key Japanese candlestick pattern
Shows bullish/bearish bias for 5 timeframes in one panel. Three bias methods, alignment summary, fully configurable.
Displays the POC line for previous sessions in an easy to see manner.
With this Fibonacci retracement indicator, traders have full control over the retracement levels displayed on the chart.
high and low
is a trend-following indicator designed to provide a clear view of market direction, momentum, and strength
buy and sell
Project market behavior by integrating price and volume data across multiple time dimensions
Volume distribution analysis with Market Profile TPO integration.
Automatically draws major, minor, and trace support/resistance levels at round numbers
IBS Indicator – Measures price position within bars for smarter trades. Works on all markets & timeframes.
A simple tool to control market sessions. For Tokyo,London, New York
Supertrend Indicator for cTrader
Market Structure Shift – Professional Market Structure Oscillator
Enhance your trading with customizable alerts and dynamic visual tools for trendlines, Fibonacci levels, and more.
Seit 03/10/2024
143
Verkäufe
32.29K
Kostenlose Installationen