
Opis
📈 Średnia Ruchoma Sygnału 📉
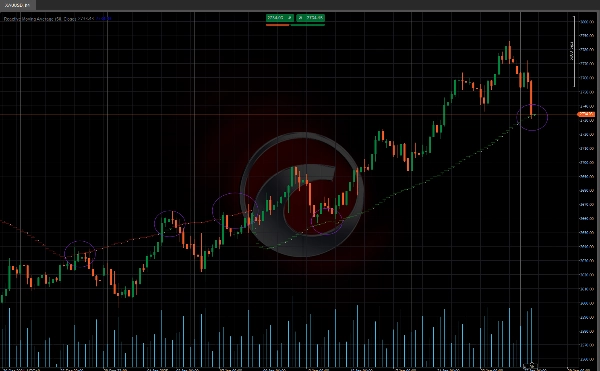
Średnia Ruchoma Sygnału (Signal Moving Average) to wskaźnik łączący Prostą Średnią Ruchomą (SMA) z dynamicznym obliczaniem korelacji, aby lepiej dostosować się do warunków rynkowych. 🎯 Ten wskaźnik dostosowuje swoją czułość w oparciu o siłę trendu, co czyni go potężnym narzędziem do identyfikacji trendów i filtrowania szumów rynkowych. 🌟
Kluczowe cechy 🔑
📊 Dostosowana Średnia Ruchoma:
- Linia średniej ruchomej dynamicznie dostosowuje się na podstawie korelacji między ceną a czasem.
- Na rynkach o silnym trendzie średnia ruchoma porusza się szybciej, aby podążać za ceną. 🚀
- Na rynkach bocznych średnia ruchoma pozostaje bardziej stabilna, redukując fałszywe sygnały. 🛑
🔢 Obliczanie Korelacji:
- Wskaźnik oblicza korelację między ceną a czasem za pomocą wzoru Pearsona.
- Dostosowuje średnią ruchomą na podstawie współczynnika determinacji (R²). 🧮
👀 Wizualizacja:
- Jasny i intuicyjny wyświetlacz ułatwiający interpretację. 📉📈
Jak używać wskaźnika 🛠️
🔍 Identyfikacja trendu:
- Trend wzrostowy: Gdy cena znajduje się powyżej skorelowanej średniej ruchomej. 🐂
- Trend spadkowy: Gdy cena znajduje się poniżej skorelowanej średniej ruchomej. 🐻
✅ Potwierdzenie sygnału:
- Używaj dostosowanej średniej ruchomej jako dynamicznego poziomu wsparcia lub oporu. 🛡️
- Łącz ten wskaźnik z innymi narzędziami technicznymi, aby potwierdzić sygnały. 🔄
Dostosowanie średniej ruchomej ⚙️
Algorytm dostosowuje średnią ruchomą na podstawie wartości R²:
- Jeśli R² > 0,5 (istotna korelacja):
-
- Średnia ruchoma jest dostosowywana za pomocą ważonej kombinacji między aktualną wartością SMA a poprzednią wartością dostosowanej średniej ruchomej (_ma).
- Ważenie zależy od wartości R². ⚖️
- Jeśli R² ≤ 0,5 (nieistotna korelacja):
-
- Średnia ruchoma jest dostosowywana przez odjęcie wartości proporcjonalnej do bezwzględnej różnicy między aktualną wartością SMA a poprzednią wartością dostosowanej średniej ruchomej. 🔄
- Wskaźniki ze sklepu Ctrader:
Dynamiczna struktura rynku
Analiza punktów zwrotnych
Regresja liniowa Fibonacciego
Wieloczasowa regresja
Wielopoziomowe uprzedzenie świecowe
Tracker
Automatyczne linie wsparcia i
oporu trendu
Podsumowanie
Key functionalities include:
- **Adjusted Moving Average**: The moving average line dynamically adapts according to the correlation between price and time. It accelerates in strong trending markets to closely follow price movements and stabilizes in sideways markets to minimize false signals.
- **Correlation Calculation**: Utilizes the Pearson formula to compute the correlation between price and time, adjusting the moving average based on the coefficient of determination (R²).
- **Moving Average Adjustment**: When R² is greater than 0.5, the moving average is updated using a weighted combination of the current SMA and the previous adjusted value, with weights depending on R². For R² less than or equal to 0.5, adjustments are made by subtracting a value proportional to the difference between the current SMA and prior adjusted average.
- **Visualization**: Provides a clear and intuitive display for easy interpretation.
Usage involves identifying bullish trends when price is above the adjusted moving average and bearish trends when below. The indicator can also serve as a dynamic support or resistance level and be combined with other technical tools for signal confirmation.
Opinie klientów
5 | 100 % | |
4 | 0 % | |
3 | 0 % | |
2 | 0 % | |
1 | 0 % |


![Logo „Gaussian Channel [Iridio Capital]”](https://cdn.ctrader.com/image/webp/7c039209-5573-4a54-a072-f9528b503103_41960)


