
คำอธิบาย
ตัวชี้วัด Pinescriptlabs Store: Pinescriptlabs Store cBots : (cBot) Gold & BTC BreakoutSession Pivots(ใหม่)
PRICE ACTION (ใหม่)
Trailing Smart Algorithm (ใหม่)
Prediction Based on Linreg & ATR
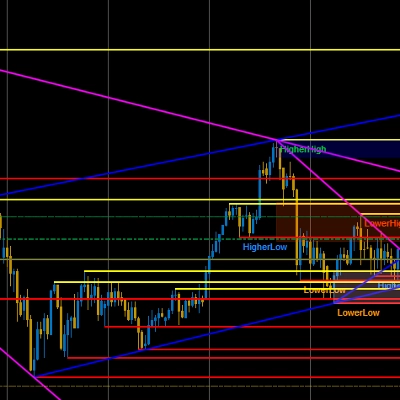
SmartTrend Support &
Resistance
Lines
Dynamic
Market Structure
Analysis
of
Turning
Points
Fibonacci
Linear
Regression
Multi-timeframe
Multi-Level
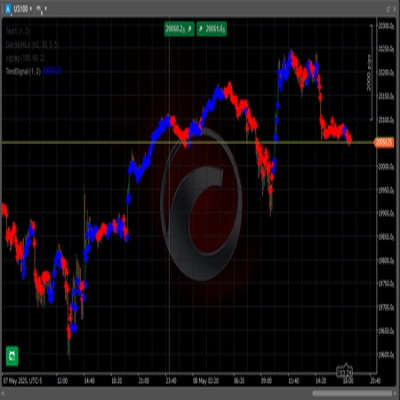
Candle Bias
Tracker
Auto
Support and
Resistance
Trend
Lines
All
Support and
Resistance
Levels
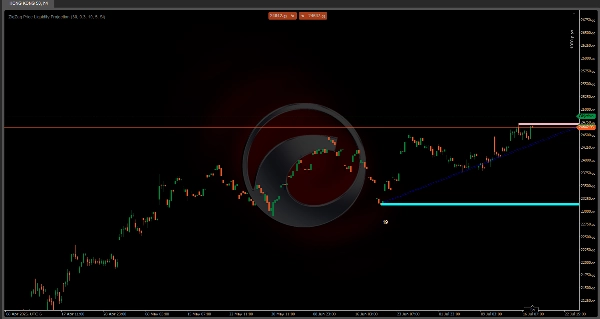
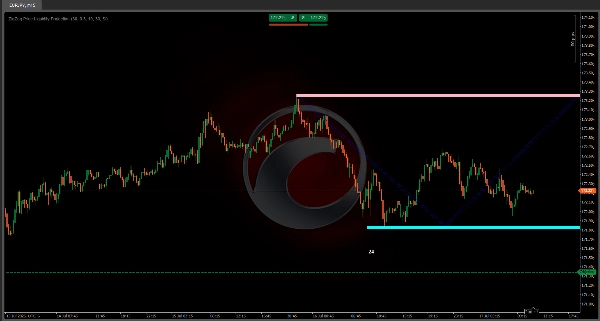
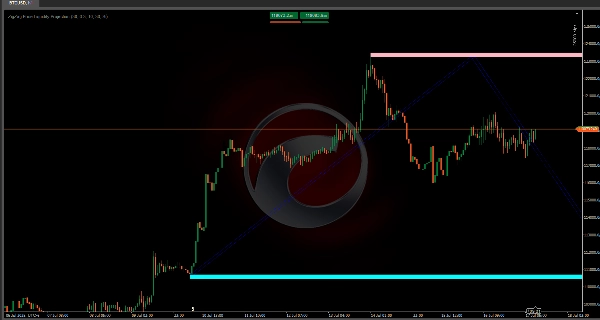
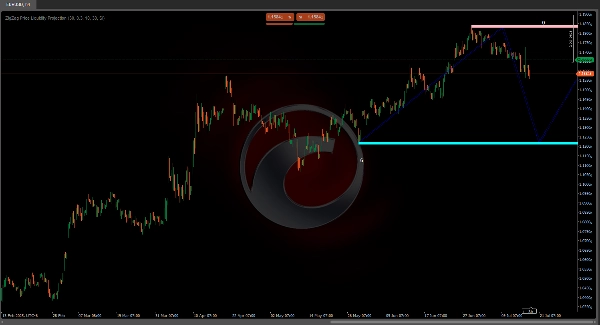
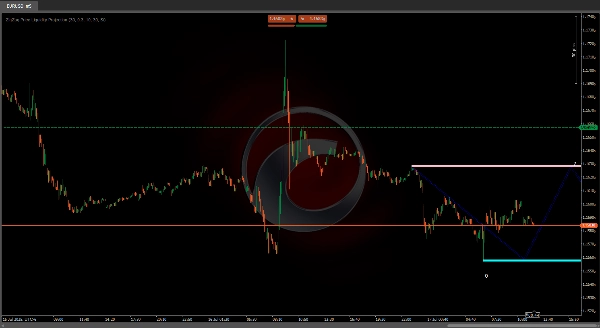
📊 ตัวชี้วัดการคาดการณ์สภาพคล่องราคาของ ZigZag
"ดูว่าตลาดอาจจะกลับตัวที่ไหนก่อนที่จะเกิดขึ้น!" 🔮
ตัวชี้วัดนี้ระบุ ระดับแนวรับ/แนวต้านสำคัญ 🛑 และ ทำนายโซนสภาพคล่อง 💧 บนกราฟของคุณโดยใช้:
- 🔍 จุดหมุน: ตรวจจับจุดสูงสุดและต่ำสุดที่สำคัญ
- 📈 ความผันผวน ATR: วัดความผันผวนของราคาเพื่อการปรับแต่งที่แม่นยำ
- 💦 การคาดการณ์สภาพคล่อง: คาดการณ์พื้นที่กิจกรรมสูง (กลุ่มซื้อ/ขาย) ผ่านรูปแบบซิกแซก
🎯 จุดประสงค์: ทำนายโซนปฏิกิริยาของราคา (การดีดตัว/การเบรกเอาท์/การรวมตัว) เพื่อปรับปรุงการตัดสินใจเข้า/ออก
✨ ข้อได้เปรียบของ Zigzag
เส้นที่เชื่อมต่อเหล่านี้ทำหน้าที่เหมือน แผนที่ขุมทรัพย์ 🗺️ แสดง:
1️⃣ เส้นทางราคาที่จะเกิดขึ้นในอนาคต ภายในช่วงที่กำหนด
2️⃣ โซนที่อาจเกิดการกลับตัว ที่ราคาสามารถหยุดหรือตีกลับ
3️⃣ จุดอ้างอิงภาพ สำหรับการวางแผนการเทรด
🚦 คุณสมบัติหลัก:
- 📅 ระบบเตือนล่วงหน้า สำหรับระดับสำคัญ
- 🎯 คาดการณ์การเคลื่อนไหวในอนาคต โดยอิงจากโครงสร้างจุดหมุน (เส้นทางขาขึ้น/ขาลง)
- 🔢 ตัวนับการสัมผัส (เช่น "24" = ทดสอบระดับนั้น 24 ครั้งในอดีต)
⚙️ การตั้งค่าที่แนะนำ
การตั้งค่า ค่าผลกระทบ
ช่วงเวลา ATR
30
🎚️ ความไวต่อความผันผวน
ช่วงเวลาจุดหมุน
30
🔍 ช่วงความสำคัญของจุดหมุน
⏳ ช่วงเวลาที่ดีที่สุด: กราฟ 15 นาที - 4 ชั่วโมง ⏱️
💡 เคล็ดลับมือโปร:
"ผสมผสานกับรูปแบบแท่งเทียน 🕯️ เพื่อยืนยัน! Zigzag แสดงที่ที่ราคาอาจไป แท่งเทียนแสดงเวลาที่มันเกิดขึ้น."
🎯 สรุปสุดท้าย:
เครื่องมือภาพรวมที่ทรงพลัง ครบวงจร สำหรับการระบุ:
✅ โซนสภาพคล่อง 💦
✅ ระดับสำคัญ 🎯
✅ เส้นทางราคาที่จะเกิดขึ้น 🚀
เหมาะสำหรับเทรดเดอร์รายวันที่ต้องการ คาดการณ์การเคลื่อนไหวแทนการไล่ตาม! 🏃💨


!["[Stellar Strategies] Smart ADX" โลโก้](https://cdn.ctrader.com/image/webp/af13b084-b6f6-41db-b7bc-c7e688b57b05_36929)


