คำอธิบาย
ตัวบ่งชี้ Pinescriptlabs Store: Pinescriptlabs Store cBots : (cBot) Gold & BTC BreakoutSession Pivots(ใหม่)
Prediction Based on Linreg & ATR
SmartTrend Support &
Resistance
Lines
Dynamic
Market Structure
Analysis
of
Turning
Points
Fibonacci
Linear
Regression
Multi-timeframe
Multi-Level
Candle Bias
Tracker
Auto
Support and
Resistance
Trend
Lines
All
Support and
Resistance
Levels
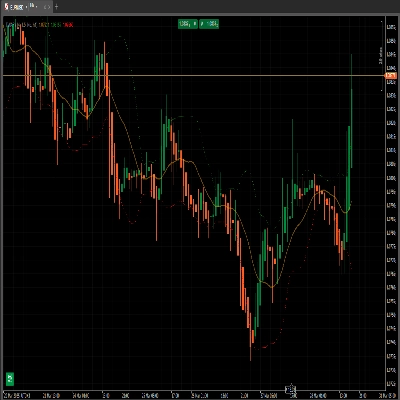
MarketImbalanceDetector ระบุความไม่สมดุลของตลาดและทำเครื่องหมายพื้นที่สำคัญอย่างชัดเจนตามรูปแบบราคาและความผันผวน (ATR) นี่คือการสรุปง่ายๆ ว่าทำงานอย่างไร:
🔍 การตรวจจับสัญญาณ
มันเปรียบเทียบราคาของแท่งก่อนหน้าเพื่อค้นหารูปแบบกระทิงหรือหมี โดยใช้เงื่อนไขเฉพาะ (เช่น การเปรียบเทียบจุดต่ำสุดและสูงสุดของแท่งก่อนหน้า) และกรองสัญญาณด้วยความผันผวนปัจจุบัน เพื่อให้แน่ใจว่าการเคลื่อนไหวมีความสำคัญ
📊 การแสดงภาพความไม่สมดุล
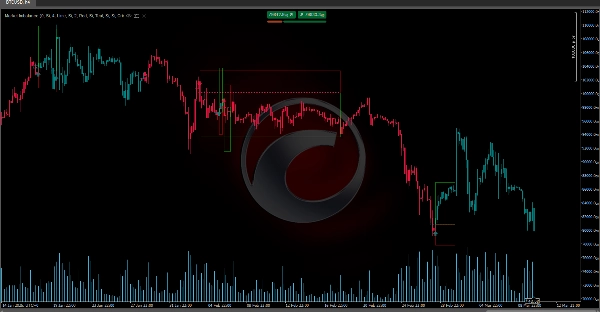
เมื่อมีการระบุสัญญาณ ตัวบ่งชี้จะวาดบนแผนภูมิ:
- พื้นที่ความไม่สมดุล (สี่เหลี่ยมผืนผ้า) ที่ทำเครื่องหมายโซนที่เกิดรูปแบบนั้นขึ้น
- เส้นระดับเฉลี่ย (คำนวณจากจุดสูงสุดและต่ำสุดที่เกี่ยวข้อง) เพื่อช่วยในการแสดงภาพการสนับสนุนหรือแนวต้าน
- ไอคอน (ลูกศร) ที่แสดงทิศทางของสัญญาณ (⬆️ สำหรับกระทิง, ⬇️ สำหรับหมี)
โซน OP/PE
นอกจากนี้ยังสร้างโซนที่เรียกว่า OP () และ PE (Escape Point). โซนเหล่านี้คำนวณโดยการเพิ่มหรือลดค่าคูณของ ATR ไปยังระดับเฉลี่ย ช่วยกำหนดพื้นที่สำหรับการทำกำไรหรือการตัดขาดทุน
สรุป
When a signal is detected, the indicator visually marks the chart with:
- An Imbalance Area (a rectangle) highlighting the zone where the pattern occurred.
- An Average Level Line calculated from relevant highs and lows to indicate potential support or resistance.
- An Icon (arrow) showing the signal direction: upward for bullish and downward for bearish.
Additionally, the indicator calculates OP (Order Point) and PE (Escape Point) zones by adding or subtracting multiples of ATR to the average level. These zones assist traders in defining areas for taking profit or cutting losses.
This tool supports analysis across various markets including cryptocurrencies (e.g., BTCUSD), commodities (e.g., XAUUSD), and integrates concepts related to breakout strategies, trend indicators like Supertrend, and momentum measures such as RSI. It is intended to enhance market structure understanding and assist in decision-making by visually representing key imbalance zones on trading charts.