Mô tả
Kênh giá động sử dụng các trung bình động trên cả bốn giá OHLC để phân tích cấu trúc thị trường hoàn chỉnh.
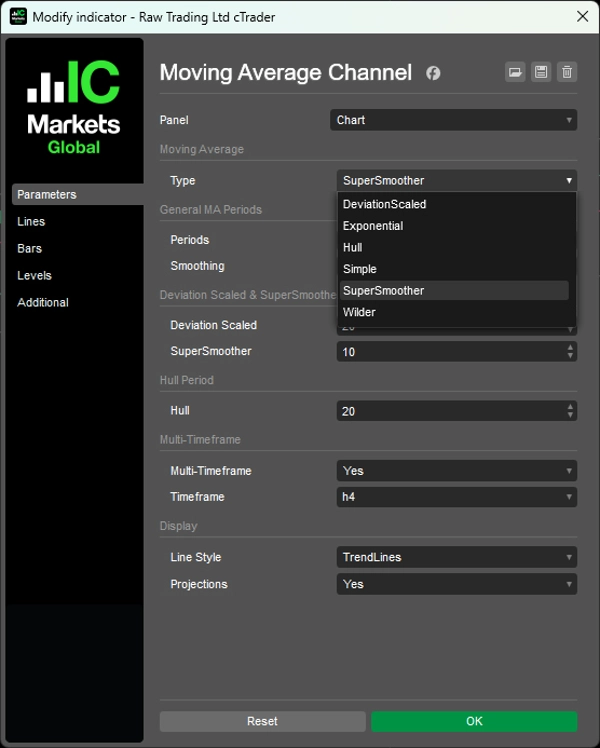
Áp dụng loại MA bạn chọn (Đơn giản, Lũy thừa, Wilder, Tỷ lệ Sai lệch, SuperSmoother, Hull) cho các ranh giới Cao/Thấp, xu hướng hướng mở/đóng, và đường cân bằng Trung vị để trực quan hóa kênh đồng bộ.
Các vùng hồi Fibonacci tích hợp sẵn (38,2%, 61,8%), lớp làm mượt kép cho SMA/EMA tạo ra các kênh cực kỳ sạch sẽ, hiển thị đa khung thời gian với các chế độ truyền thống bậc thang hoặc đường xu hướng chéo, dự báo dựa trên động lượng thông minh, và phát hiện từ chối ranh giới cung cấp cấu trúc kênh toàn diện cho các nhà giao dịch nhắm mục tiêu hồi quy trung bình và đánh giá sức mạnh xu hướng qua các khung thời gian.
TÍNH NĂNG
Cấu Trúc Giá Hoàn Chỉnh
- Cao/Thấp xác định ranh giới kênh
- Mở/Đóng thể hiện xu hướng hướng
- Đường Trung vị: mức 50% giữa Cao/Thấp—trung tâm thực sự của cân bằng thị trường
- Bốn giá phối hợp để hiển thị bức tranh thị trường hoàn chỉnh
Vùng Hồi Tích Hợp
- Các mức Fibonacci 38,2% và 61,8% đánh dấu các khu vực hồi đáng kể về mặt thống kê
- Vùng động thích ứng với biến động giá
- Điểm tham chiếu vào và ra rõ ràng
6 Loại Trung Bình Động
- Đơn giản, Lũy thừa, Wilder, Tỷ lệ Sai lệch, SuperSmoother, Hull
- Làm mượt kép cho SMA/EMA: Chu kỳ + lớp làm mượt bổ sung cho các kênh cực kỳ sạch
- Thuật toán nâng cao: Tỷ lệ Sai lệch thích ứng với biến động, SuperSmoother loại bỏ độ trễ, Hull nhấn mạnh hành động giá gần đây
Đa Khung Thời Gian với Đường Xu Hướng
- Xem kênh khung thời gian cao hơn trên biểu đồ khung thời gian thấp hơn
- Hai chế độ hiển thị: Đường bậc thang truyền thống hoặc đường xu hướng chéo (chỉ MTF)
- Đường nối các đóng cửa thanh MTF cho cấu trúc chéo sạch
- Dự báo thông minh cho thấy hướng kênh dựa trên động lượng hiện tại
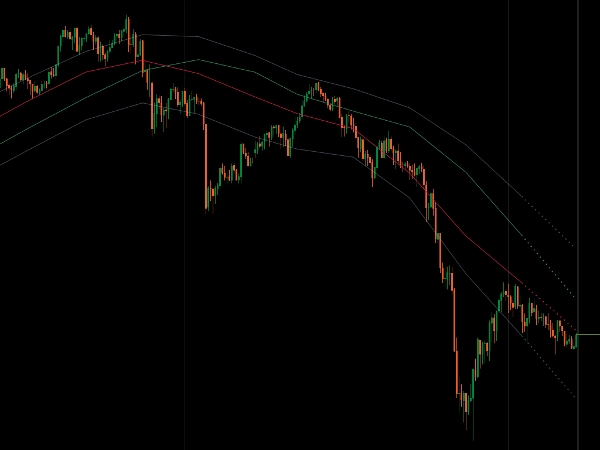
Hệ Thống Trực Quan Sạch
- Độ dốc kênh thể hiện động lượng
- Vị trí giá thể hiện sức mạnh xu hướng
- Từ chối ranh giới báo hiệu khả năng đảo chiều
- Một chỉ báo cho phân tích cấu trúc thị trường hoàn chỉnh
__________________________________________________________________________________________
THÊM CÁC CHỈ BÁO MIỄN PHÍ
Khám phá nhiều công cụ phân tích thị trường—từ cấu trúc và khối lượng đến hồi quy, biến động và khung thời gian tùy chỉnh.
Mã nguồn có sẵn trên kho lưu trữ GitHub.
Tất cả đều miễn phí sử dụng. Nhưng nếu bạn muốn hỗ trợ cà phê, bạn có thể gửi tại đây.
Hỗ Trợ/Kháng Cự
Khối Lượng
- Volume Activity Profiler
- Volume Efficiency Analyzer
- Volume Profile Analytics
- Volume Profile - Updated
- Volume Spread Analysis
- VWAP (Giá Trung Bình Trọng Số Khối Lượng)
Trung Bình Động
- SSL Channel
- Anchored Moving Average
- Deviation-Scaled Moving Average
- Gann High Low Activator
- Instantaneous Trendline
- Kaufman Adaptive MA with Trend Vision
- Moving Average Channel
- Moving Averages Suite
- Trend Channel Moving Average
Tiện Ích/Tùy Chỉnh
Dựa Trên Hồi Quy
Biến Động
Bộ Dao Động
__________________________________________________________________________________________
TỪ CHỐI TRÁCH NHIỆM
Giao dịch có rủi ro. Chỉ báo này chỉ dành cho phân tích kỹ thuật — luôn áp dụng quản lý rủi ro phù hợp và giao dịch có trách nhiệm.
PHẢN HỒI & CẢI TIẾN
Nếu bạn có đề xuất, yêu cầu tính năng hoặc ý tưởng cải tiến, vui lòng để lại bình luận trong tab Thảo luận. Phản hồi của bạn giúp cải thiện chỉ báo cho mọi người.
Tóm tắt
The indicator incorporates built-in Fibonacci reversion zones at 38.2% and 61.8%, which dynamically adjust with price movement to highlight significant pullback areas and provide clear entry and exit reference points. It supports multi-timeframe analysis, allowing higher timeframe channels to be displayed on lower timeframe charts, with two visualization modes: traditional stairstep lines or diagonal trendlines connecting multi-timeframe bar closes. Smart momentum-based projections indicate potential channel direction, while boundary rejection detection signals possible reversals.
This tool offers a cohesive visual system where channel slope reflects momentum and price position indicates trend strength, enabling traders to assess trend direction, momentum shifts, and mean reversion zones across various markets including Forex, Indices, Commodities, Crypto, and Stocks.