
Mô tả
TỔNG QUAN
Chỉ báo này thực hiện phương pháp "Xác định xu hướng bằng lọc giá và thời gian" của Alfred François Tagher, được xuất bản trong số tháng 2 năm 2024 của tạp chí Technical Analysis of Stocks & Commodities.
Khái niệm kết hợp hành động giá với lọc dựa trên thời gian để giảm nhiễu thị trường và xác định các xu hướng bền vững. Thay vì phản ứng với mọi biến động giá, chỉ báo chỉ thay đổi hướng xu hướng khi giá đóng cửa vượt ra ngoài phạm vi của kỳ trước — một điều kiện báo hiệu động lực thực sự thay vì dao động ngẫu nhiên.
QUY TẮC CƠ BẢN
Các quy tắc gốc rất đơn giản:
- Nếu giá đóng cửa của kỳ vượt quá mức cao của kỳ trước → xu hướng là TĂNG
- Nếu giá đóng cửa của kỳ thấp hơn mức thấp của kỳ trước → xu hướng là GIẢM
- Xu hướng giữ nguyên cho đến khi xảy ra điều kiện đảo chiều
Phương pháp này lọc ra các biến động giá nhỏ nằm trong phạm vi của kỳ trước, chỉ tập trung vào các đột phá thể hiện sự cam kết.
CÁCH HOẠT ĐỘNG
Chỉ báo so sánh giá đóng cửa của khung thời gian hiện tại với mức cao và thấp của kỳ trước trong khung thời gian cao hơn đã chọn:
- Xu hướng tăng: Giá đóng cửa hiện tại > Mức cao kỳ trước
- Xu hướng giảm: Giá đóng cửa hiện tại < Mức thấp kỳ trước
- Không thay đổi: Giá đóng cửa nằm trong phạm vi của kỳ trước
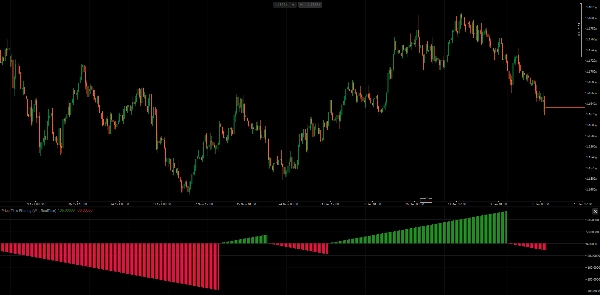
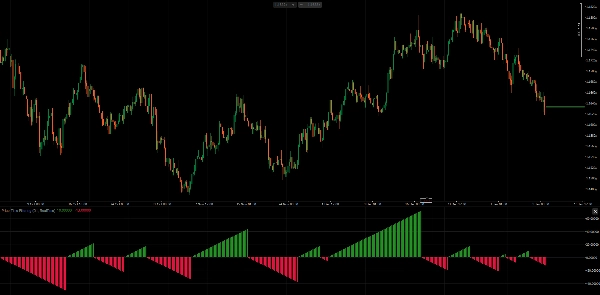
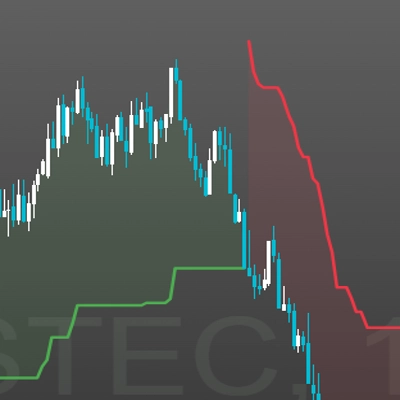
Biểu đồ histogram hiển thị số lượng thanh đang chạy theo hướng xu hướng hiện tại — giá trị dương cho xu hướng tăng, giá trị âm cho xu hướng giảm. Điều này giúp trực quan hóa cả hướng và độ dài của xu hướng.
CHẾ ĐỘ LỌC
1. Chế độ PeriodEnd Đánh giá xu hướng chỉ khi một kỳ của khung thời gian cao hơn hoàn thành. Điều này phù hợp với phương pháp gốc, nơi xu hướng hàng tuần được xác định bởi giá đóng cửa thứ Sáu (hoặc giá đóng cuối tháng đối với khung tháng). Ổn định hơn, ít tín hiệu hơn.
2. Chế độ RealTime Đánh giá xu hướng trên mỗi thanh bằng cách sử dụng giá đóng cửa hiện tại so với phạm vi của kỳ trước. Cung cấp tín hiệu sớm hơn nhưng có thể tạo ra nhiều nhiễu hơn trong kỳ.
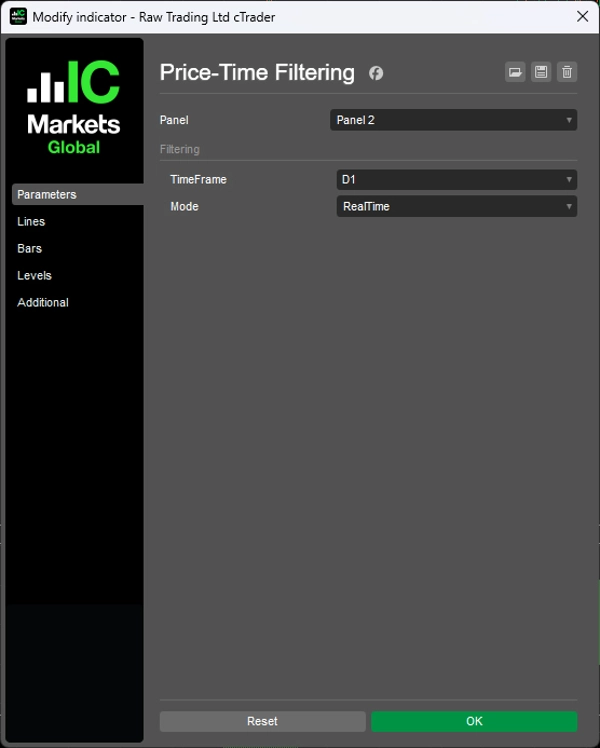
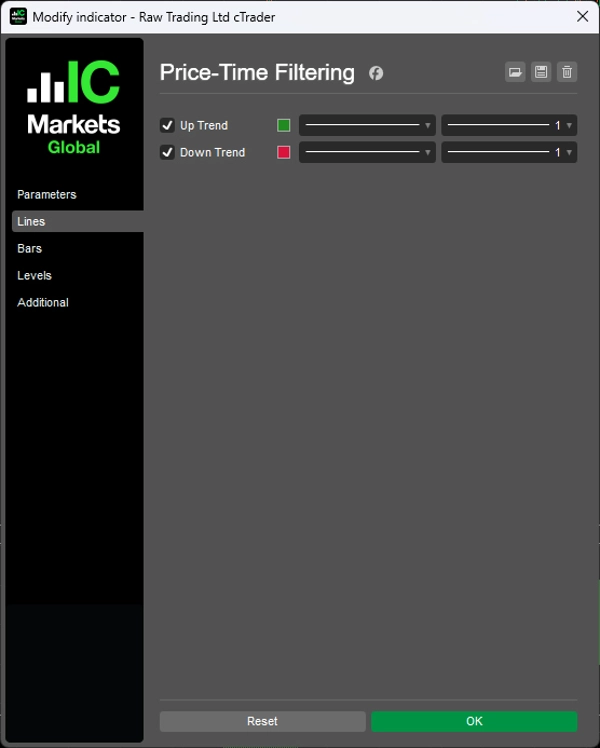
THAM SỐ
- Khung thời gian: Khung thời gian cao hơn để đánh giá xu hướng (ví dụ: Hàng tuần, Hàng tháng)
- Chế độ: PeriodEnd (phương pháp gốc) hoặc RealTime (biến thể phản ứng nhanh)
DIỄN GIẢI
- Histogram màu xanh lá: Xu hướng tăng đang diễn ra, số lượng thanh cho thấy độ dài xu hướng
- Histogram màu đỏ: Xu hướng giảm đang diễn ra, số lượng thanh cho thấy độ dài xu hướng
- Đặt lại histogram: Đã xảy ra đảo chiều xu hướng
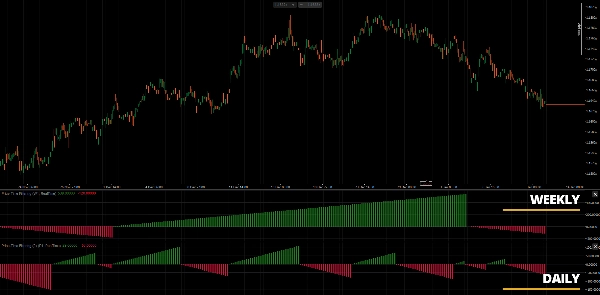
Chỉ báo hoạt động tốt nhất trên biểu đồ hàng ngày với lựa chọn khung thời gian Hàng tuần hoặc Hàng tháng, như mô tả trong bài viết gốc. Tuy nhiên, việc triển khai hỗ trợ bất kỳ kết hợp khung thời gian nào.
GHI CHÚ
- Ban đầu được thiết kế cho biểu đồ hàng ngày với đánh giá hàng tuần/hàng tháng
- Hoạt động trên bất kỳ kết hợp khung thời gian nào mà khung thời gian được chọn cao hơn khung thời gian biểu đồ
- Số lượng thanh cung cấp thước đo độ trưởng thành của xu hướng — số lượng dài hơn cho thấy xu hướng đã được thiết lập
- Cân nhắc kết hợp với phân tích cấu trúc giá để xác định thời điểm vào lệnh
THAM KHẢO
Tagher, Alfred François. "Trend Identification By Price And Time Filtering." Technical Analysis of Stocks & Commodities, February 2024.
__________________________________________________________________________________________
NHIỀU CHỈ BÁO MIỄN PHÍ KHÁC
Khám phá nhiều công cụ phân tích thị trường — từ cấu trúc và khối lượng đến hồi quy, biến động và khung thời gian tùy chỉnh.
Mã nguồn có sẵn trên kho GitHub.
Tất cả đều miễn phí sử dụng. Nhưng nếu bạn muốn gửi hỗ trợ cà phê, bạn có thể chuyển đến đây.
Hỗ trợ/Kháng cự
Khối lượng
- Volume Activity Profiler
- Volume Efficiency Analyzer
- Volume Profile Analytics
- Volume Profile - Updated
- Volume Spread Analysis
- VWAP (Volume Weighted Average Price)
Đường trung bình động
- SSL Channel
- Anchored Moving Average
- Deviation-Scaled Moving Average
- Gann High Low Activator
- Instantaneous Trendline
- Kaufman Adaptive MA with Trend Vision
- Moving Average Channel
- Moving Averages Suite
- Trend Channel Moving Average
Tiện ích/Tùy chỉnh
Dựa trên hồi quy
Biến động
Bộ dao động
__________________________________________________________________________________________
TỪ CHỐI TRÁCH NHIỆM
Giao dịch có rủi ro. Chỉ báo này chỉ dành cho phân tích kỹ thuật — luôn áp dụng quản lý rủi ro phù hợp và giao dịch có trách nhiệm.
PHẢN HỒI & CẢI TIẾN
Nếu bạn có đề xuất, yêu cầu tính năng hoặc ý tưởng cải tiến, vui lòng để lại bình luận trong tab Thảo luận. Phản hồi của bạn giúp cải thiện chỉ báo cho mọi người.
Tóm tắt
The indicator supports two filtering modes: PeriodEnd mode, which evaluates trends only at the close of a higher timeframe period (e.g., weekly or monthly), providing more stable signals; and RealTime mode, which updates trend status on every bar for more responsive but potentially noisier signals. Users can select the higher timeframe for trend evaluation, typically weekly or monthly, while applying the indicator on lower timeframe charts.
A histogram visually represents trend direction and duration, with positive values and green bars indicating uptrends, negative values and red bars indicating downtrends, and resets marking trend reversals. The indicator is applicable across various markets including Forex, indices, commodities, crypto, and stocks, and supports any timeframe combination where the selected higher timeframe exceeds the chart timeframe.


![Logo "[Hamster-Coder] Pivot Points (Demo)"](https://cdn.ctrader.com/image/webp/87b54299-8c73-4942-9207-4bc6db824811_31153)
