
Mô tả
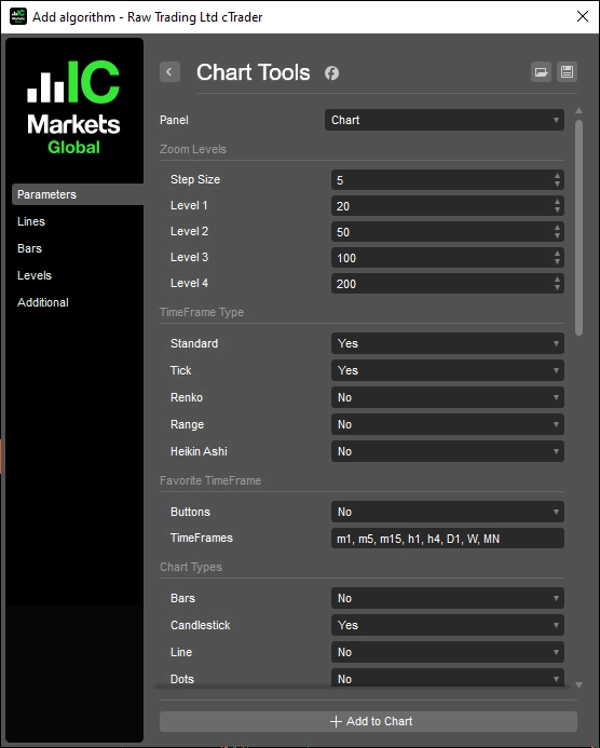
Bảng điều khiển biểu đồ để điều hướng nhanh hơn — phóng to, khung thời gian và cài đặt biểu đồ mà không cần rời khỏi biểu đồ.
Các cài đặt phóng to sẵn, nhập phóng to thủ công, bộ chọn khung thời gian và biểu đồ đầy đủ, các khung thời gian yêu thích có thể cấu hình, các dấu phân cách khoảng thời gian, lưới số tròn và các đường giá mua/bán trực tiếp — tất cả đều có thể truy cập qua các nút giao diện người dùng trên biểu đồ. Được thiết kế để giảm thời gian điều hướng các menu gốc của cTrader trong các phiên giao dịch tích cực.
TÍNH NĂNG
Điều khiển phóng to
- Phóng to / thu nhỏ với kích thước bước có thể cấu hình
- Bốn mức phóng to sẵn có thể cấu hình để truy cập một lần nhấp
- Nhập phóng to thủ công với nút áp dụng
- Đồng bộ với các sự kiện phóng to gốc của cTrader
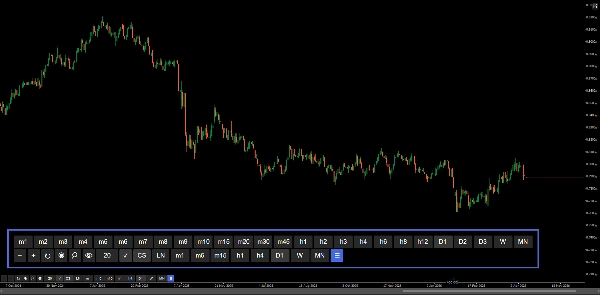
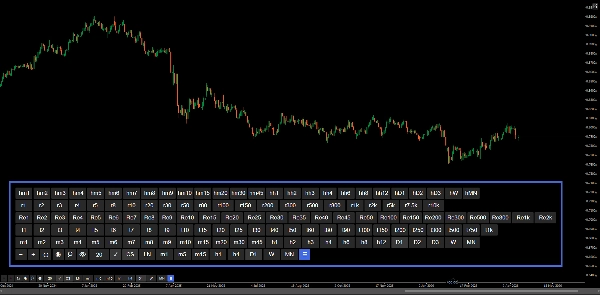
Bộ chọn khung thời gian
- Bảng nút đầy đủ bao gồm tất cả các loại khung thời gian: Tiêu chuẩn, Heikin Ashi, Renko, Range, Tick
- Chế độ tất cả hiển thị mỗi loại dưới dạng các hàng riêng biệt
- Khung thời gian đang hoạt động được tô sáng tự động
- Chuyển đổi hiển thị bảng điều khiển bằng nút ☰
Khung thời gian yêu thích
- Hàng truy cập nhanh có thể cấu hình qua đầu vào phân tách bằng dấu phẩy (ví dụ: m1, h1, D1)
- Hỗ trợ tất cả các loại khung thời gian bao gồm Range và Tick
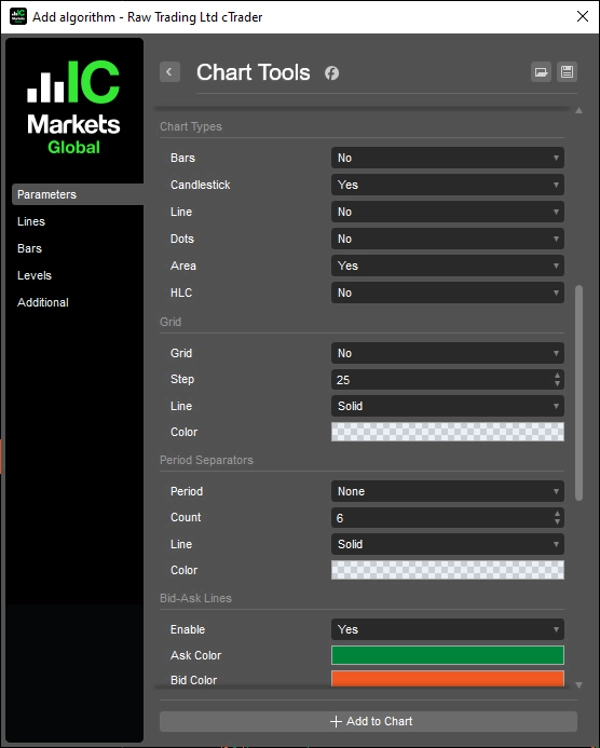
Loại biểu đồ
- Nút chuyển đổi nhanh cho: Bars, Candlestick, Line, Dots, Area, HLC
- Loại biểu đồ đang hoạt động được tô sáng tự động
- Mỗi nút có thể cấu hình riêng qua các tham số
Lưới
- Lưới dựa trên số tròn với khoảng cách pip có thể cấu hình (Bội số)
- Nhãn giá với định dạng thập phân thông minh
- Các đường kéo dài 10 thanh vượt quá thanh cuối cùng
- Bật/tắt chuyển đổi
Dấu phân cách khoảng thời gian
- Dấu phân cách hàng ngày, hàng tuần, hàng tháng và hàng năm
- Số lượng, màu sắc, kiểu đường và độ dày có thể cấu hình
- Tự động cập nhật khi cuộn và phóng to
Đường giá mua/bán
- Đường giá mua và bán trực tiếp kéo dài vô hạn
- Màu sắc có thể cấu hình cho giá bán và giá mua
- Bật/tắt chuyển đổi
Nút bấm
- Vị trí: Góc trên bên phải, góc trên bên trái, góc dưới bên phải, góc dưới bên trái
- Lề có thể cấu hình
- Màu nút và màu chữ có thể cấu hình — bao gồm trạng thái hoạt động, áp dụng phóng to và nút chuyển đổi biểu đồ
__________________________________________________________________________________________
NHIỀU CHỈ BÁO MIỄN PHÍ HƠN
Khám phá một loạt các công cụ phân tích thị trường — từ cấu trúc và khối lượng đến hồi quy, biến động và các khung thời gian tùy chỉnh.
Mã nguồn có sẵn trên kho lưu trữ GitHub.
Tất cả đều miễn phí sử dụng. Nhưng nếu bạn muốn gửi hỗ trợ cà phê, bạn có thể chuyển đến đây.
Hỗ trợ/Kháng cự
Khối lượng
- Volume Activity Profiler
- Volume Efficiency Analyzer
- Volume Profile Analytics
- Volume Profile - Cập nhật
- Volume Spread Analysis
- VWAP (Giá trung bình trọng số theo khối lượng)
Đường trung bình động
- Kênh SSL
- Đường trung bình động neo
- Đường trung bình động tỷ lệ độ lệch
- Bộ kích hoạt Gann High Low
- Đường xu hướng tức thời
- Đường trung bình động thích nghi Kaufman với Trend Vision
- Kênh đường trung bình động
- Bộ đường trung bình động
- Đường trung bình động kênh xu hướng
Tiện ích/Tùy chỉnh
Dựa trên hồi quy
Biến động
Bộ dao động
__________________________________________________________________________________________
TỪ CHỐI TRÁCH NHIỆM
Giao dịch có rủi ro. Chỉ báo này chỉ dành cho phân tích kỹ thuật — luôn áp dụng quản lý rủi ro phù hợp và giao dịch có trách nhiệm.
PHẢN HỒI & CẢI TIẾN
Nếu bạn có đề xuất, yêu cầu tính năng hoặc ý tưởng cải tiến, vui lòng để lại bình luận trong tab Thảo luận. Phản hồi của bạn giúp cải thiện chỉ báo cho mọi người.
Tóm tắt
Users can configure a quick-access row of favorite timeframes supporting all timeframe types. The chart type switcher offers quick buttons for Bars, Candlestick, Line, Dots, Area, and HLC charts, each with individual configuration and automatic active state highlighting.
Additional features include a round numbers-based grid with configurable pip intervals and smart decimal formatting, daily to yearly period separators with customizable appearance, and live bid/ask lines extending indefinitely with color customization and toggle options.
The control panel’s buttons can be positioned in any corner of the chart with configurable margins and colors, including active states and zoom application. This tool aims to streamline active trading sessions by reducing time spent navigating native menus, supporting efficient technical analysis on various chart types and timeframes.
Đánh giá của khách hàng
5 | 100 % | |
4 | 0 % | |
3 | 0 % | |
2 | 0 % | |
1 | 0 % |


![Logo "[Hamster-Coder] Bollinger Bands"](https://cdn.ctrader.com/image/webp/21d8e5d6-fb11-4bac-b9ee-cd05c2b76804_30327)


![Logo "[Hamster-Coder] Price"](https://cdn.ctrader.com/image/webp/893fb641-d5b3-44d8-91fb-6a2dc6f3d309_30647)


