
Mô tả
Pinescritlabs
Chỉ báo Ctrader Store: 🤖Pinescritlabs cBots Ctrader Store:
Phiên Fair Value Gap Phiên Đột Phá Vàng & BTC Pivots(mới)
Cấu Trúc Thị Trường Động
Phân Tích Điểm Quay
Fibonacci Tuyến Tính
Hồi Quy Đa Khung Thời Gian
Định Hướng Nến Đa Cấp
Theo Dõi
Đường Hỗ Trợ và
Kháng Cự Xu Hướng Tự Động
Tất Cả Các Mức Hỗ Trợ và
Kháng Cự
Đường Xu Hướng Hỗ Trợ và Kháng Cự Tự Động:
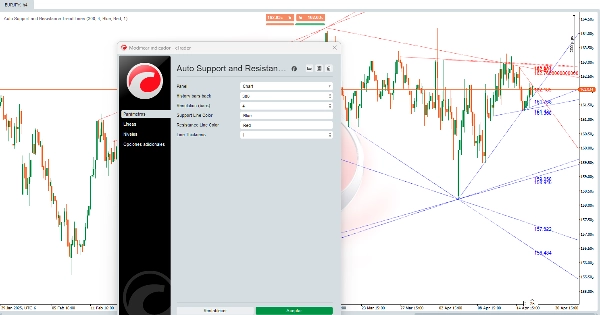
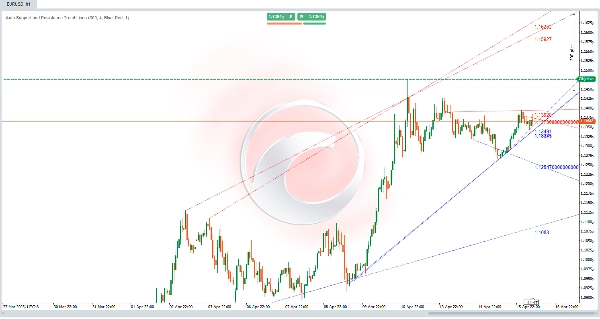
Thuật toán này là một công cụ mạnh mẽ 🛠️ được thiết kế để tự động xác định các mức hỗ trợ và kháng cự trên biểu đồ giá. Nó không chỉ vẽ các đường ngang, mà còn theo dõi các kênh chéo ↗️↘️ đại diện cho xu hướng thị trường. Những mức và kênh này là các khu vực then chốt nơi giá đã gặp khó khăn trong việc tăng cao hơn (kháng cự 🚧) hoặc giảm thấp hơn (hỗ trợ 🛡️), làm cho chúng trở thành điểm quan trọng cho các quyết định giao dịch. 📈📉
Các phép tính được thực hiện như thế nào? 🔍
Thuật toán sử dụng một phương pháp phân tích lịch sử giá 📊 để xác định các mức hỗ trợ và kháng cự. Đây là cách nó hoạt động:
- Xác định các đáy và đỉnh cục bộ ⬇️⬆️
-
- Thuật toán phân tích giá trong một phạm vi cụ thể của các thanh (nến) để tìm đáy cục bộ (giá thấp nhất trong phạm vi đó) và đỉnh cục bộ (giá cao nhất trong phạm vi đó).
- Những đáy và đỉnh cục bộ này là ứng viên tiềm năng để trở thành các mức hỗ trợ và kháng cự.
- Xác thực các mức ✔️
-
- Khi các đáy và đỉnh cục bộ được xác định, thuật toán kiểm tra xem các mức này có được tôn trọng bởi giá trong quá khứ hay không.
- Nếu giá chạm một mức nhiều lần mà không phá vỡ rõ ràng, mức đó được coi là mức hỗ trợ hoặc kháng cự hợp lệ.
- Vẽ các đường và kênh ✏️
-
- Các mức hỗ trợ được vẽ dưới dạng đường ngang (hoặc chéo) tại các đáy cục bộ đã được xác thực.
- Các mức kháng cự được vẽ dưới dạng đường ngang (hoặc chéo) tại các đỉnh cục bộ đã được xác thực.
- Ngoài ra, thuật toán kết nối các mức này để tạo thành các kênh chéo ↗️↘️, đại diện cho xu hướng tăng hoặc giảm trong thị trường.
- Cập nhật động 🔄
-
- Chỉ báo tự động cập nhật với mỗi thanh mới, tính toán lại và vẽ lại các mức hỗ trợ và kháng cự dựa trên hành vi giá gần nhất.
Thuật toán này giúp các nhà giao dịch như thế nào? 💡
Thuật toán này là một bước ngoặt cho các nhà giao dịch bởi vì:
- Cung cấp cái nhìn tổng quan về thị trường 🌐
-
- Bằng cách vẽ các kênh chéo, thuật toán hiển thị các xu hướng chính của thị trường, giúp nhà giao dịch xác định liệu giá đang trong một xu hướng tăng 📈, xu hướng giảm 📉, hoặc di chuyển ngang ↔️.
- Xác định các khu vực hỗ trợ và kháng cự chính 🎯
-
- Các mức hỗ trợ và kháng cự là vùng nơi giá có thể đảo chiều hoặc phá vỡ. Những mức này hữu ích cho:
-
- Xác định điểm vào và điểm ra cho các giao dịch.
- Đặt stop-loss 🛑 và take-profit ✅.
- Xác định đột phá 🚀 hoặc đảo chiều 🔄 của giá.
- Đơn giản hóa phân tích kỹ thuật 🕒
-
- Thuật toán tự động hóa quá trình xác định hỗ trợ và kháng cự, giúp tiết kiệm thời gian cho các nhà giao dịch thực hiện phân tích thủ công.
- Bằng cách hiển thị rõ ràng các mức và kênh, nó giúp nhà giao dịch đưa ra quyết định sáng suốt hơn.
- Có thể tùy chỉnh 🎨
-
- Các nhà giao dịch có thể điều chỉnh các tham số như số lượng thanh lịch sử được phân tích, độ dày đường, và màu sắc, cho phép chỉ báo được tùy chỉnh phù hợp với các phong cách giao dịch và sở thích thị giác khác nhau.
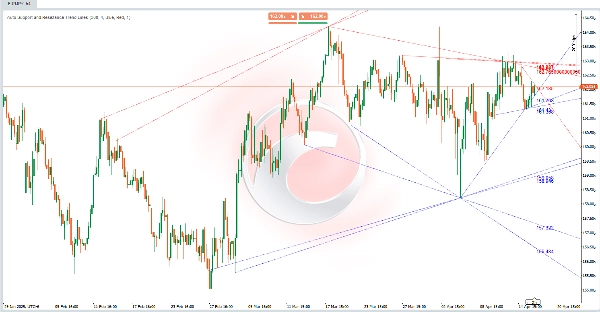
Ví dụ thực tế 📌
Hãy tưởng tượng bạn đang phân tích một biểu đồ giá, và thuật toán đã vẽ:
- Một đường hỗ trợ chéo ↗️ nối nhiều đáy cục bộ, chỉ ra một xu hướng tăng.
- Một đường kháng cự chéo ↗️ nối nhiều đỉnh cục bộ, cho thấy một kênh tăng.
- Nhiều đường ngang đại diện cho các mức hỗ trợ và kháng cự chính.
Với thông tin này, bạn có thể:
- Xác định rằng giá đang trong một xu hướng tăng 📈.
- Tìm kiếm cơ hội mua gần đường hỗ trợ chéo hoặc các mức hỗ trợ ngang.
- Đặt một stop-loss 🛑 dưới mức hỗ trợ gần nhất.
- Quan sát xem giá phá vỡ kháng cự để xác nhận sự tiếp tục của xu hướng hoặc một đảo chiều 🔄 tiềm năng.
Tóm tắt
Once validated, support and resistance levels are drawn as horizontal or diagonal lines, and connected to form channels indicating bullish or bearish trends. The indicator updates dynamically with each new bar, recalculating and redrawing levels to reflect the most recent price behavior.
This tool aids traders by providing a macro view of market trends, identifying zones where price may bounce or break, and simplifying technical analysis through automation. It supports setting entry and exit points, stop-loss and take-profit orders, and spotting potential breakouts or reversals. Parameters such as the number of historical bars analyzed, line thickness, and colors can be customized to fit different trading styles and preferences.


![Logo "[CB] Pivot Points Pro"](https://cdn.ctrader.com/image/webp/43463c82-67b0-4f10-a4ba-901bba091d81_32594)
![Logo "[Stellar Strategies] Smart ADX"](https://cdn.ctrader.com/image/webp/af13b084-b6f6-41db-b7bc-c7e688b57b05_36929)


