
الوصف
إصدار محدث متاح — هنا
تم إصدار نسخة محدثة من هذا المؤشر مع إصلاحات وتحسينات هامة:
- توزيع الحجم ثابت: تخصيص نسبي بناءً على تداخل الشمعة (بدلاً من 100% لجميع المستويات التي تم لمسها)
- تصحيح اكتشاف VAH/VAL: الآن يتحجّم التسامح مع ارتفاع المستوى بدلاً من القيمة الثابتة
- تصحيح تموضع النص: إزاحات ديناميكية بناءً على الإطار الزمني بدلاً من أيام ثابتة
- معامل تعويض المنطقة الزمنية: لملفات تعريف التاريخ والوقت
- معامل موضع النص: خيار التمركز يسار/يمين لوضع النظر للخلف
- تحسينات الأداء: بحث ثنائي للبحث عن التاريخ والوقت، حسابات الحجم المخزنة مؤقتًا، عمليات القاموس المحسّنة
__________________________________________________________________________________________
ملاحظات مهمة - اقرأ أولاً
حجم الفوركس ليس الحجم الحقيقي
الحجم في الفوركس هو حجم التيك — يحسب عدد مرات تغير السعر. لا يحسب مقدار المال المتداول.
ما لا يمكن أن يظهره حجم التيك
- حجم الصفقة. صفقة بقيمة 100 دولار وصفقة بقيمة 10,000,000 دولار كلاهما يُحسب كتيك واحد.
- تدفق المال الحقيقي. لا يمكنك رؤية ما إذا كان المال الكبير أو الصغير هو من حرك السعر.
- السيولة الحقيقية. لا يمكنك رؤية عدد الأوامر المنتظرة في السوق.
- نشاط البنوك. البنوك ترى بيانات الحجم الحقيقي. أنت لا ترى.
ماذا يعني هذا
حجم التيك يظهر فقط عدد مرات تغير السعر — وليس المال وراءه. هذا يخلق مشاكل:
- لا يمكنك تتبع البنوك أو المؤسسات. هم يستخدمون بيانات الحجم الحقيقي التي لا يمكنك الوصول إليها.
- لا يمكنك إثبات نظريات "المال الذكي". هذه الأفكار تحتاج حجمًا حقيقيًا، وليس عداد التيك.
- لا يمكنك الحكم على السيولة الحقيقية. نشاط التيك لا يظهر عمق الأوامر أو قوة السوق الحقيقية.
- لا يمكنك قياس قوة الشراء أو البيع الحقيقية. العديد من الصفقات الصغيرة تبدو مثل صفقة مؤسسية كبيرة واحدة.
- ارتفاعات الحجم قد تكون مضللة. قد يكون الارتفاع مجرد ضوضاء خوارزمية، وليس اهتمامًا حقيقيًا بالتداول.
كيفية استخدام هذا المؤشر بشكل صحيح
- اعتبره مقياس نشاط، وليس مقياس مال. حجم التيك العالي = السوق نشط. حجم التيك المنخفض = السوق هادئ. لا أكثر من ذلك.
- قارن النشاط بين أوقات مختلفة. استخدمه لمعرفة: هل جلسة لندن أكثر نشاطًا من نيويورك؟ هل اليوم أكثر نشاطًا من الأمس؟ هل فترة الاتجاه أكثر نشاطًا من فترة التوحيد؟
- ادمجه مع هيكل السعر. استخدم الدعم/المقاومة، نقاط التأرجح، أو BOS/ChoCH مع الحجم. سياق السعر يمنع الإشارات الخاطئة من ارتفاعات الحجم المزعجة.
- راقب النشاط عند مستويات السعر المهمة. عندما يختبر السعر مستوى رئيسي ويزداد حجم التيك، فهذا يعني أن المزيد من المتداولين نشطون. لا يعني أن اللاعبين الكبار متورطون.
- لا تفترض أنه يظهر نشاط المؤسسات. حجم التيك لا يمكن أن يظهر التراكم، أو الأوامر الكبيرة، أو "المال الذكي". استخدمه فقط لقياس الإيقاع والسرعة.
__________________________________________________________________________________________
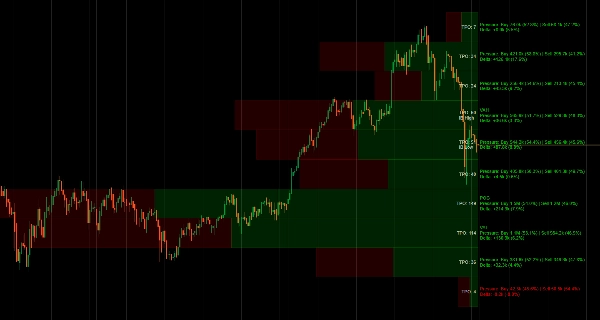
تصور توزيع الحجم والوقت المنقضي عند السعر مع تتبع POC، منطقة القيمة، وملف السوق TPO.
يعرض هذا المؤشر توزيع الحجم باستخدام مفاهيم ملف السوق. يعرض نقطة التحكم (أعلى مستوى نشاط التيك)، حدود منطقة القيمة (حيث حدث معظم التداول)، تسلسلات حروف TPO (الوقت المنقضي عند كل سعر)، وتصوير الدلتا الذي يقسم نشاط التيك حسب اتجاه الشمعة.
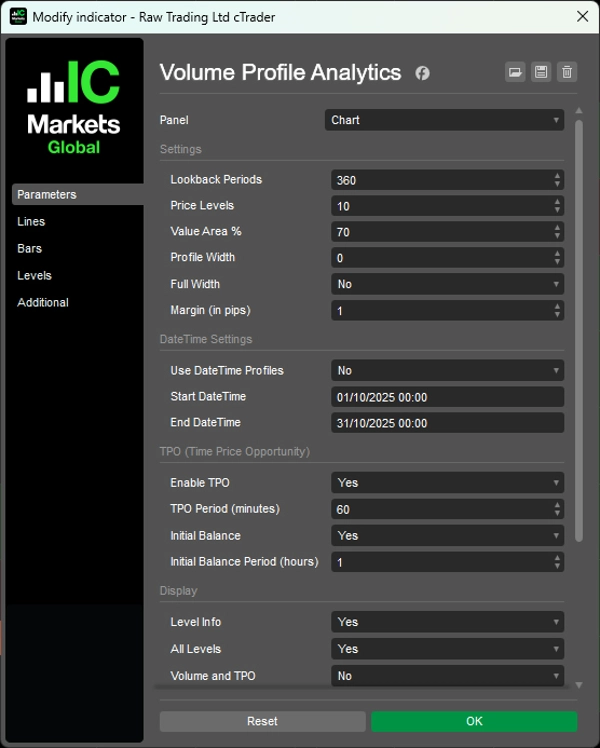
يمكنك اختيار فترات النظر للخلف أو تعيين نطاقات تواريخ محددة، عرض أشرطة الحجم كنسبية أو بعرض كامل، التبديل بين جميع المستويات أو المستويات الرئيسية فقط، وتخصيص الألوان للنشاط الصاعد/الهابط.
الميزات
تحليل توزيع الحجم
- نقطة التحكم (POC): مستوى السعر بأعلى نشاط — حيث قضى السعر معظم الوقت
- منطقة القيمة (VA): منطقة تركيز النشاط القابلة للتخصيص (الافتراضي 70%) — حيث حدث معظم التداول
- VAH/VAL: حدود منطقة القيمة العليا/الدنيا — مستويات دعم/مقاومة محتملة
- تصوير الدلتا: الأشرطة المقسمة تظهر اتجاه الشمعة عند كل مستوى سعر
ملف السوق TPO
- تتبع فرصة السعر والوقت: عد عدد الفترات الزمنية المتداولة عند كل سعر
- حروف TPO: تمثيل بصري للوقت المنقضي عند السعر (تسلسل A-Z)
- الرصيد الأولي (IB): نطاق الساعة الأولى — مهم لهياكل التداول اليومية
- علامات الحد الأعلى/الأدنى للرصيد الأولي: نطاق الافتتاح
خيارات نظر للخلف مرنة
- مبنية على الفترة: تعيين عدد الأشرطة للتحليل (مثلاً، آخر 120 شريطًا)
- نطاق التاريخ والوقت: تثبيت الملف بين تواريخ/أوقات محددة لتحليل الأحداث
- عرض ديناميكي: ملفات تعريف بمقياس تلقائي أو عرض ثابت
خيارات العرض
- أشرطة الحجم: عرض نسبي (مقياس النشاط) أو أشرطة بعرض كامل موحد
- تقسيم اتجاه الشمعة داخل كل شريط
- حسابات الدلتا مع النسب المئوية
- التبديل بين جميع المستويات أو المستويات الرئيسية فقط (POC، VAH، VAL)
- التحكم في رؤية تفاصيل الحجم/TPO
- التفصيل الاتجاهي مع النسب المئوية
- حجم خط قابل للتعديل وهوامش مبنية على النقاط
تخصيص الألوان
- ألوان مستقلة لأشرطة الاتجاه الصاعد/الهابط
- ألوان نص منفصلة للدلتا الإيجابية/السلبية
- لون نص خاص بـ TPO
محسن للأداء
- تخزين مؤقت لعمليات البحث عن الوقت ورسم مستطيلات فعال
- إعادة حساب قليلة لأداء سلس
- حساب دلتا محترف مبني على هيكل الشمعة
__________________________________________________________________________________________
مزيد من المؤشرات المجانية
استكشف مجموعة واسعة من أدوات تحليل السوق — من الهيكل والحجم إلى الانحدار، التقلب، والأطر الزمنية المخصصة.
الكود المصدري متاح على GitHub المستودع.
جميعها مجانية للاستخدام. ولكن إذا رغبت في دعم القهوة، يمكنك التبرع هنا.
الدعم/المقاومة
الحجم
- مُحلل نشاط الحجم
- محلل كفاءة الحجم
- تحليلات ملف الحجم
- ملف الحجم - محدث
- تحليل انتشار الحجم
- VWAP (متوسط السعر المرجح بالحجم)
المتوسطات المتحركة
- المتوسط المتحرك المثبت
- المتوسط المتحرك بمقياس الانحراف
- خط الاتجاه اللحظي
- متوسط كوفمان التكيفي مع رؤية الاتجاه
- قناة المتوسط المتحرك
- مجموعة المتوسطات المتحركة
- متوسط قناة الاتجاه المتحرك
الأدوات المساعدة/المخصصة
مبني على الانحدار
التقلب
المذبذبات
__________________________________________________________________________________________
إخلاء المسؤولية
التداول ينطوي على مخاطر. هذا المؤشر مخصص للتحليل الفني فقط — دائماً طبق إدارة المخاطر المناسبة وتداول بمسؤولية.
التعليقات والتحسينات
إذا كانت لديك اقتراحات أو طلبات ميزات أو أفكار لتحسين، يرجى ترك تعليق في تبويب النقاش. تساعد ملاحظاتك في تحسين المؤشر للجميع.
الملخص
Users can customize lookback periods by number of bars or specific date/time ranges and choose between proportional or full-width volume bars. The indicator also provides delta visualization, splitting tick activity by candle direction with percentage breakdowns, and offers extensive display and color customization options for bullish and bearish activity.
This tool is optimized for performance with cached calculations and efficient drawing methods. It is designed to measure market activity rhythm and tempo based on tick volume, which counts price changes but does not represent actual traded money or liquidity. It is suitable for analyzing volume distribution and market structure across various trading sessions and timeframes.
تقييمات العملاء
5 | 100 % | |
4 | 0 % | |
3 | 0 % | |
2 | 0 % | |
1 | 0 % |


![شعار "[Stellar Strategies] Smart ADX"](https://cdn.ctrader.com/image/webp/af13b084-b6f6-41db-b7bc-c7e688b57b05_36929)


