
Beschreibung
Diagramm-Steuerungspanel für schnellere Navigation — Zoom, Zeitrahmen und Diagrammeinstellungen, ohne das Diagramm zu verlassen.
Zoom-Voreinstellungen, manuelle Zoom-Eingabe, vollständiger Zeitrahmen- und Diagrammselektor, konfigurierbare Favoriten-Zeiträume, Periodentrenner, Raster mit runden Zahlen und Live-Bid/Ask-Linien — alles zugänglich über UI-Schaltflächen im Diagramm. Entwickelt, um die Zeit zu reduzieren, die beim Navigieren durch die nativen Menüs von cTrader während aktiver Handelssitzungen verbracht wird.
FUNKTIONEN
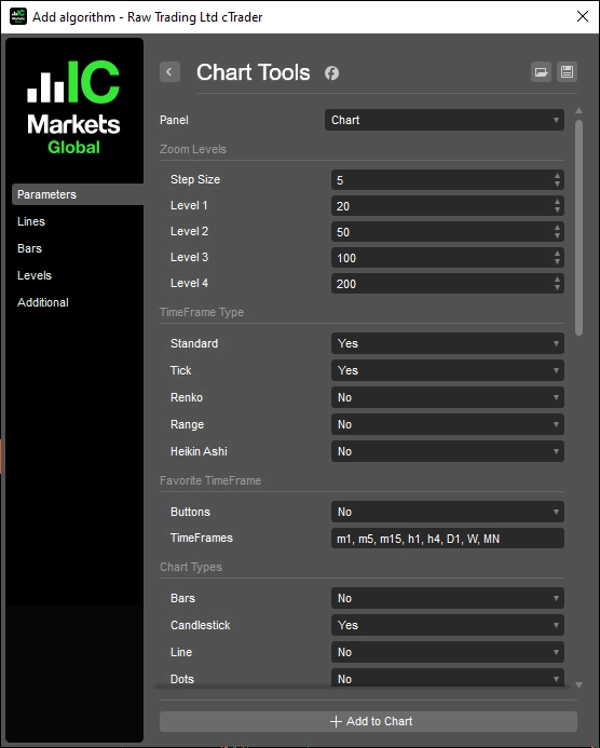
Zoom-Steuerung
- Rein- / Rauszoomen mit konfigurierbarer Schrittgröße
- Vier konfigurierbare voreingestellte Zoomstufen für den Ein-Klick-Zugriff
- Manuelle Zoom-Eingabe mit Anwenden-Schaltfläche
- Synchronisiert mit den nativen Zoom-Ereignissen von cTrader
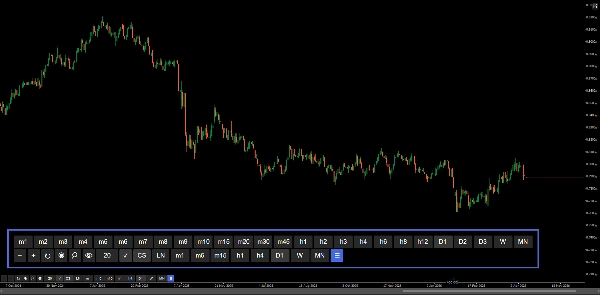
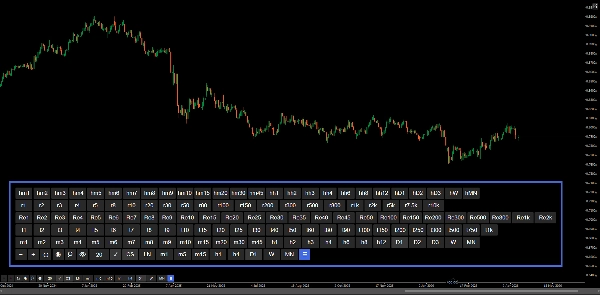
Zeitrahmen-Auswahl
- Vollständiges Schaltflächenpanel, das alle Zeitrahmentypen abdeckt: Standard, Heikin Ashi, Renko, Range, Tick
- Alle Modi zeigen jeden Typ als separate Reihen an
- Aktiver Zeitrahmen wird automatisch hervorgehoben
- Panel-Sichtbarkeit mit der ☰-Schaltfläche umschalten
Favorisierte Zeitrahmen
- Konfigurierbare Schnellzugriffsreihe über kommagetrennte Eingabe (z.B. m1, h1, D1)
- Unterstützt alle Zeitrahmentypen einschließlich Range und Tick
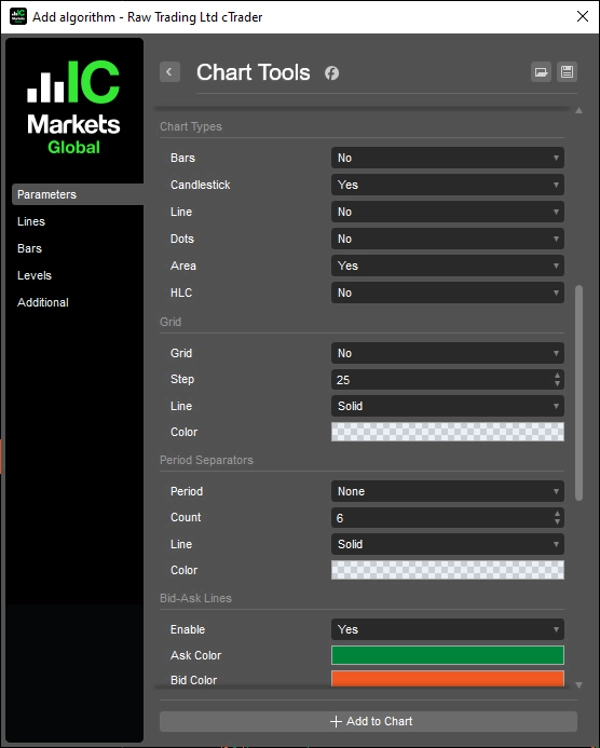
Diagrammtyp
- Schnellumschalt-Schaltflächen für: Balken, Kerzen, Linie, Punkte, Fläche, HLC
- Aktiver Diagrammtyp wird automatisch hervorgehoben
- Jede Schaltfläche individuell über Parameter konfigurierbar
Raster
- Raster basierend auf runden Zahlen mit konfigurierbarem Pip-Intervall (Multiplikator)
- Preisetiketten mit intelligenter Dezimalformatierung
- Linien erstrecken sich 10 Balken über den letzten Balken hinaus
- Ein-/Ausschalt-Schalter
Periodentrenner
- Tägliche, wöchentliche, monatliche und jährliche Trenner
- Konfigurierbare Anzahl, Farbe, Linienart und Dicke
- Automatische Aktualisierung beim Scrollen und Zoomen
Bid/Ask-Linien
- Live-Bid- und Ask-Linien, die sich ins Unendliche erstrecken
- Konfigurierbare Farben für Ask und Bid
- Ein-/Ausschalt-Schalter
Schaltflächen
- Position: Oben rechts, oben links, unten rechts, unten links
- Konfigurierbarer Rand
- Konfigurierbare Schaltflächenfarben und Textfarben — einschließlich aktivem Zustand, Zoom anwenden und Diagramm-Umschalt-Schaltfläche
__________________________________________________________________________________________
MEHR KOSTENLOSE INDIKATOREN
Entdecken Sie eine breite Palette von Marktanalysetools – von Struktur und Volumen bis hin zu Regression, Volatilität und benutzerdefinierten Zeitrahmen.
Der Quellcode ist auf GitHub Repository verfügbar.
Alle kostenlos nutzbar. Aber wenn Sie Lust haben, eine Kaffee-Unterstützung zu senden, können Sie diese hierhinleiten.
Unterstützung/Widerstand
Volumen
- Volumen-Aktivitätsprofiler
- Volumen-Effizienz-Analysator
- Volumen-Profil-Analyse
- Volumen-Profil - Aktualisiert
- Volumen-Spread-Analyse
- VWAP (Volumen-Gewichteter Durchschnittspreis)
Gleitende Durchschnitte
- SSL-Kanal
- Verankerter gleitender Durchschnitt
- Abweichungsskaliertes gleitendes Mittel
- Gann High Low Aktivator
- Momentane Trendlinie
- Kaufman Adaptive MA mit Trend Vision
- Gleitender Durchschnittskanal
- Suite für gleitende Durchschnitte
- Trendkanal-Gleitender Durchschnitt
Dienstprogramme/Benutzerdefiniert
Regression-basiert
Volatilität
Oszillatoren
__________________________________________________________________________________________
HAFTUNGSAUSSCHLUSS
Der Handel birgt Risiken. Dieser Indikator ist nur für die technische Analyse gedacht — wenden Sie stets ein angemessenes Risikomanagement an und handeln Sie verantwortungsbewusst.
FEEDBACK & VERBESSERUNGEN
Wenn Sie Vorschläge, Funktionswünsche oder Ideen zur Verbesserung haben, hinterlassen Sie bitte einen Kommentar im Diskussions-Tab. Ihr Feedback hilft, den Indikator für alle zu verbessern.
Zusammenfassung
Users can configure a quick-access row of favorite timeframes supporting all timeframe types. The chart type switcher offers quick buttons for Bars, Candlestick, Line, Dots, Area, and HLC charts, each with individual configuration and automatic active state highlighting.
Additional features include a round numbers-based grid with configurable pip intervals and smart decimal formatting, daily to yearly period separators with customizable appearance, and live bid/ask lines extending indefinitely with color customization and toggle options.
The control panel’s buttons can be positioned in any corner of the chart with configurable margins and colors, including active states and zoom application. This tool aims to streamline active trading sessions by reducing time spent navigating native menus, supporting efficient technical analysis on various chart types and timeframes.
Kundenbewertungen
5 | 100 % | |
4 | 0 % | |
3 | 0 % | |
2 | 0 % | |
1 | 0 % |


