Pinescriptlabs Store indicators: 🤖Pinescriptlabs Store cBots : (cBot)
Gold & BTC BreakoutSession Pivots(new)
SmartTrend Support &
Resistance
Lines
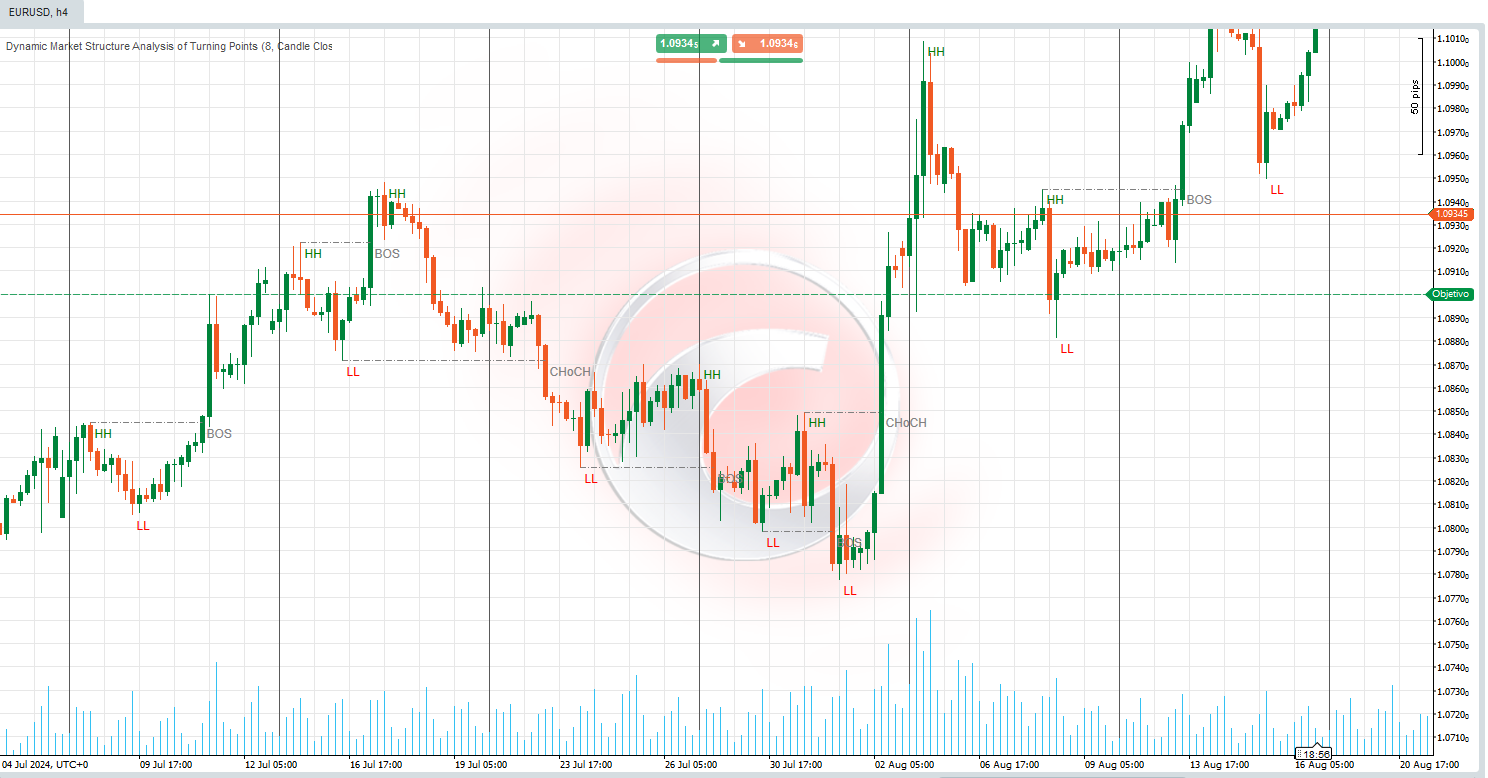
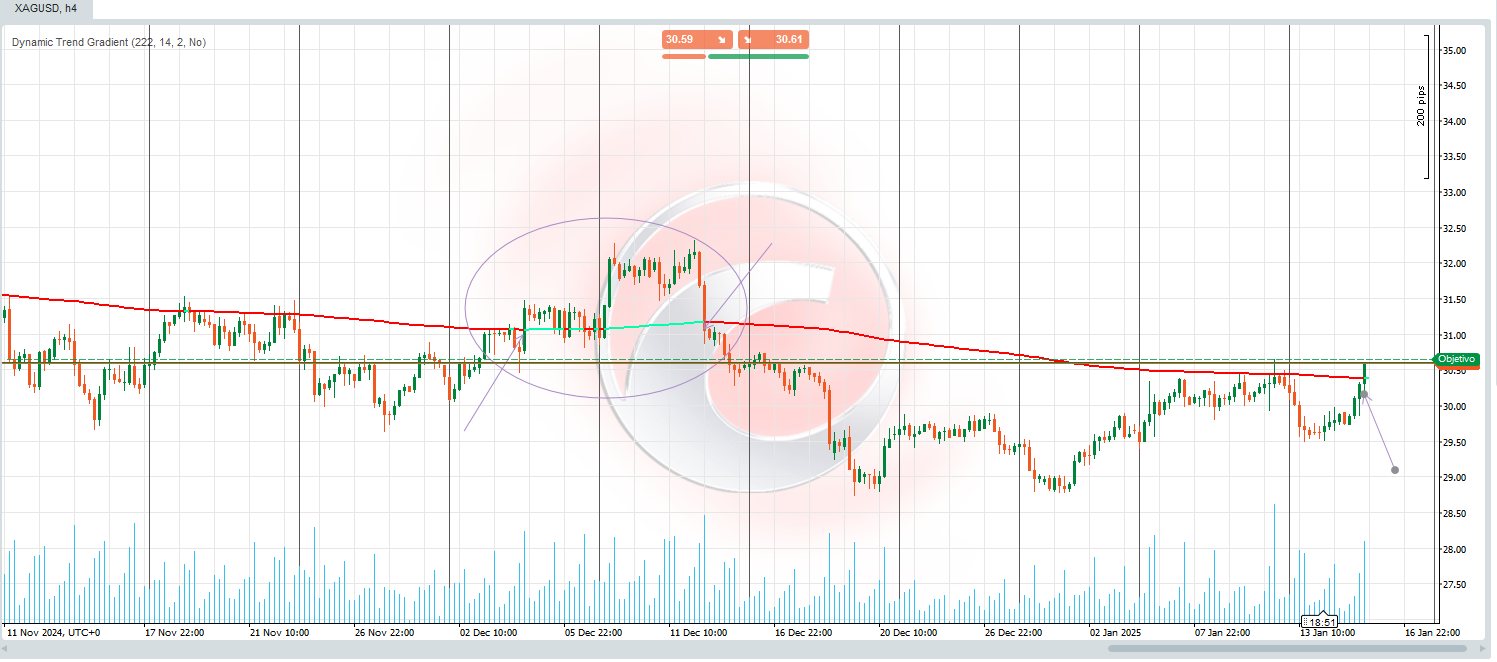
Dynamic
Market Structure
Analysis
of
Turning Points
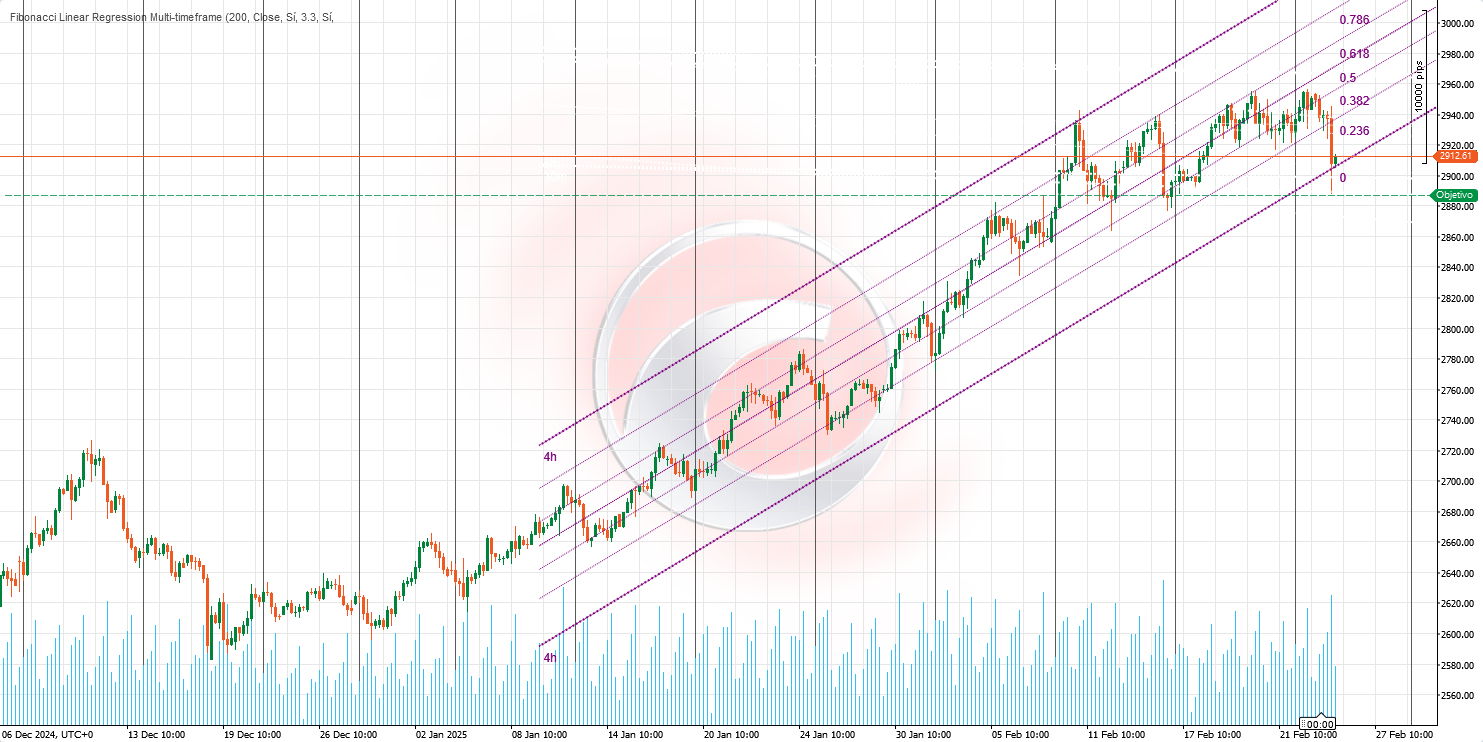
Fibonacci
Linear
Regression
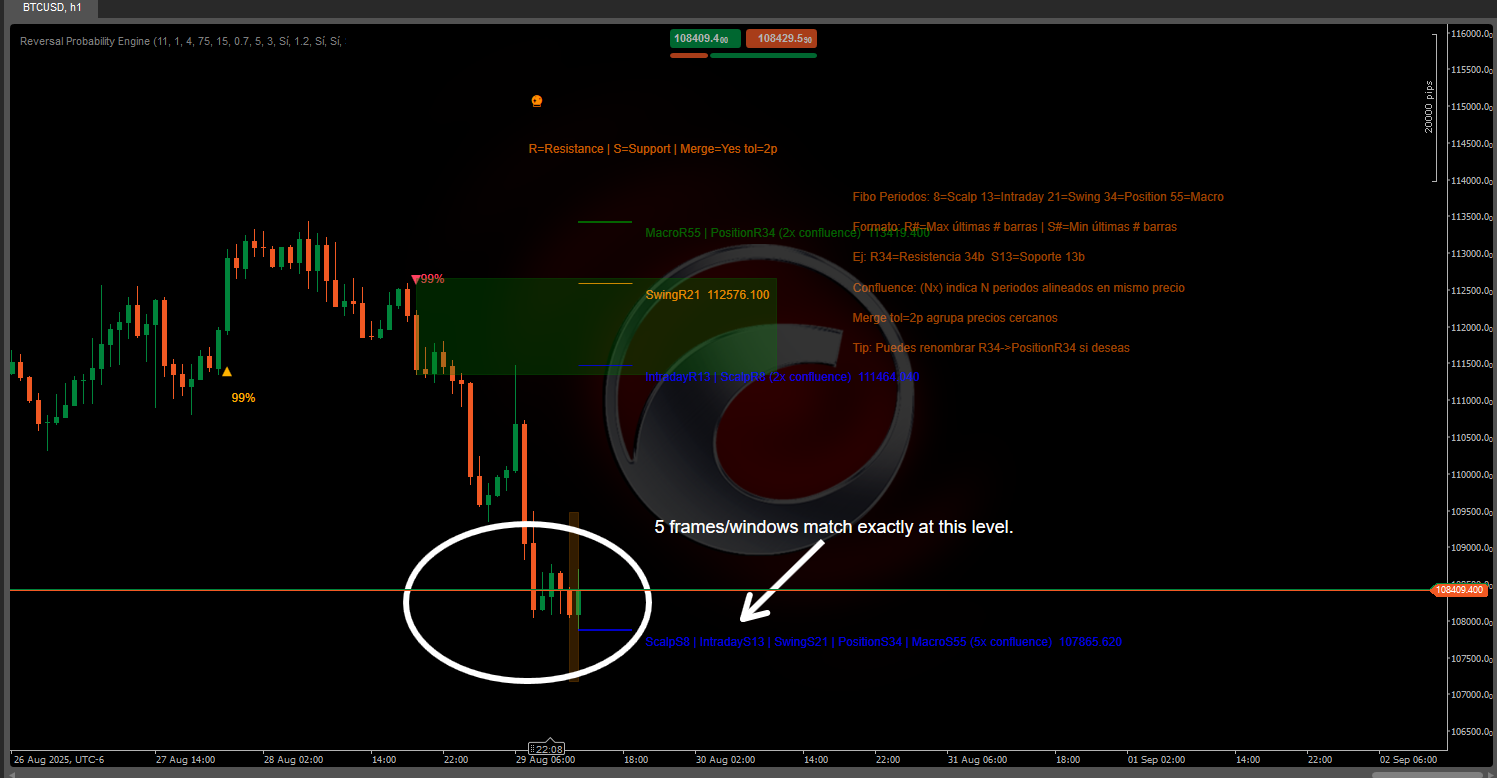
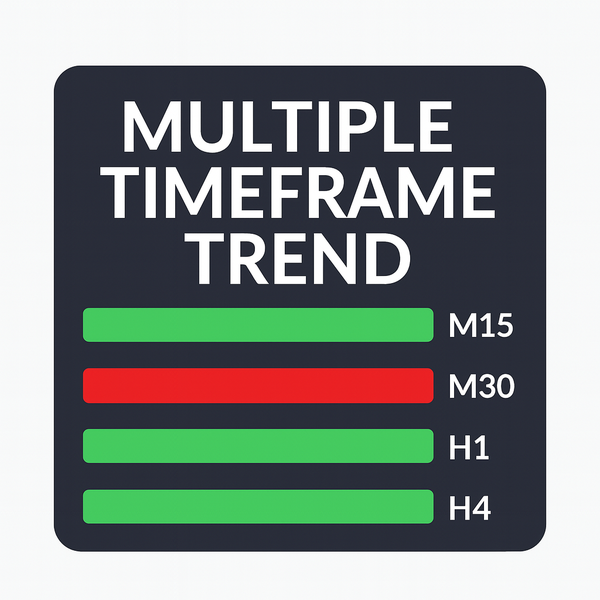
Multi-timeframe
Auto
Support and
Resistance
Trend
Lines
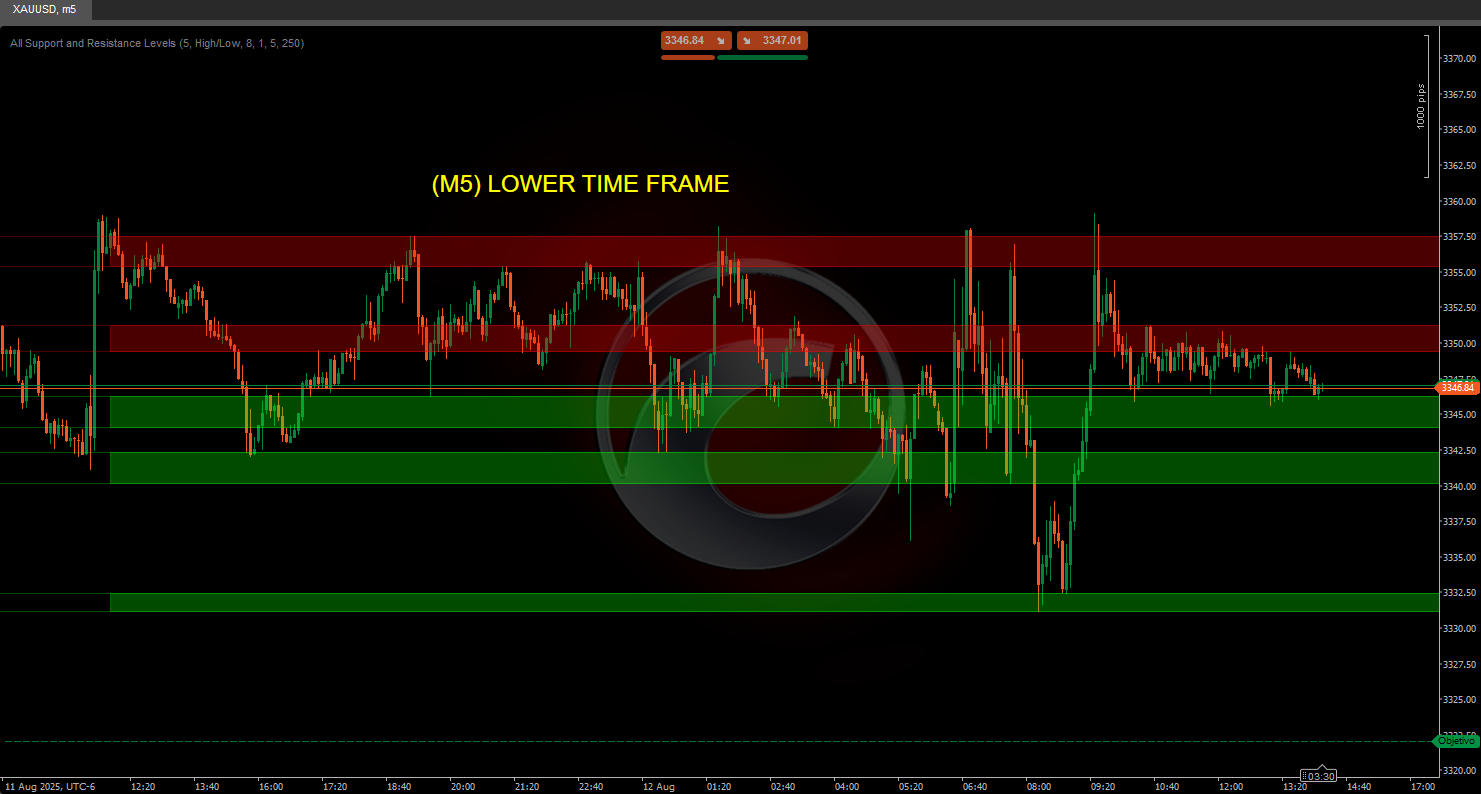
All
Support and
Resistance
Levels
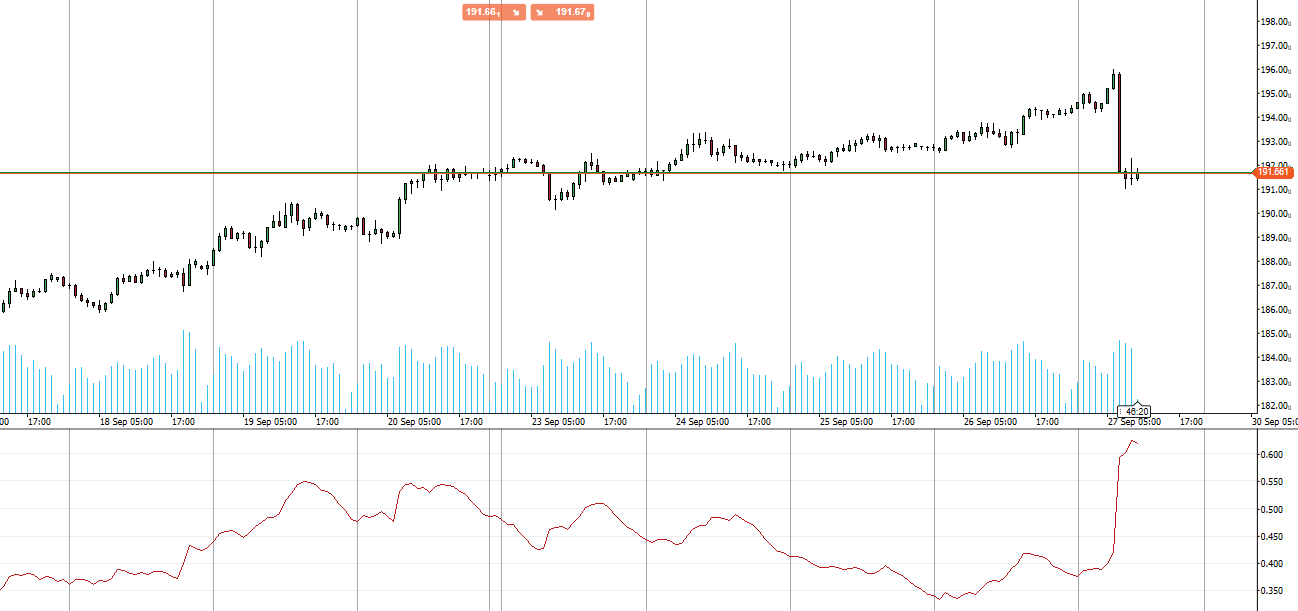
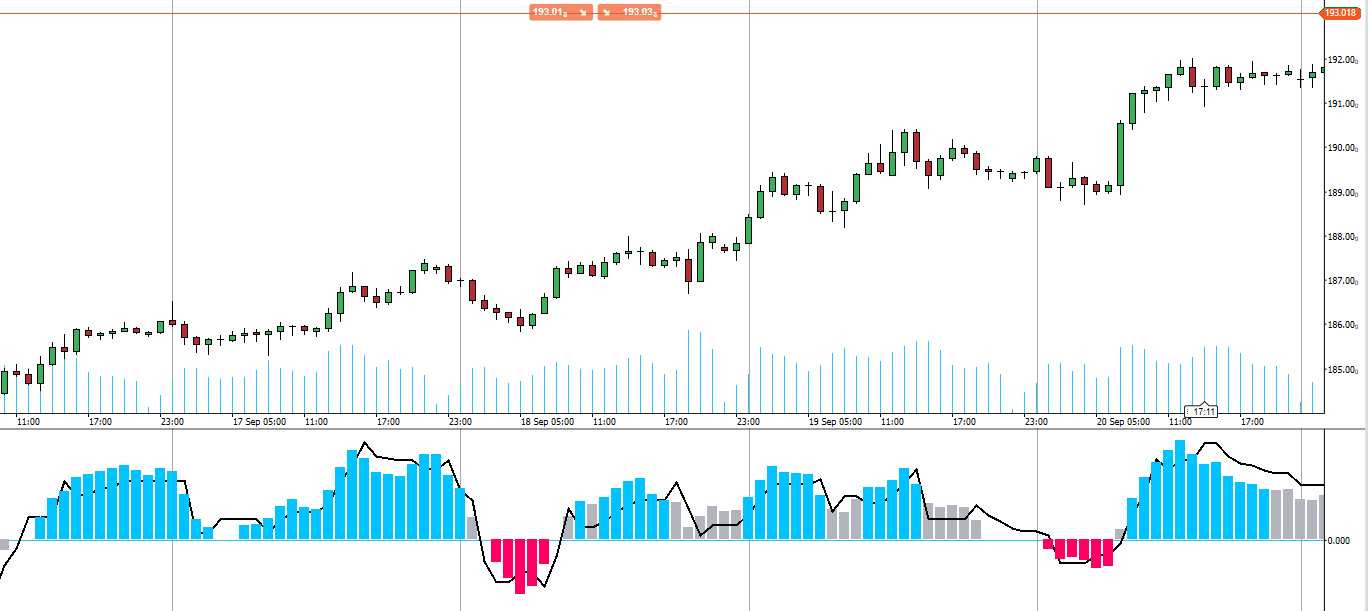
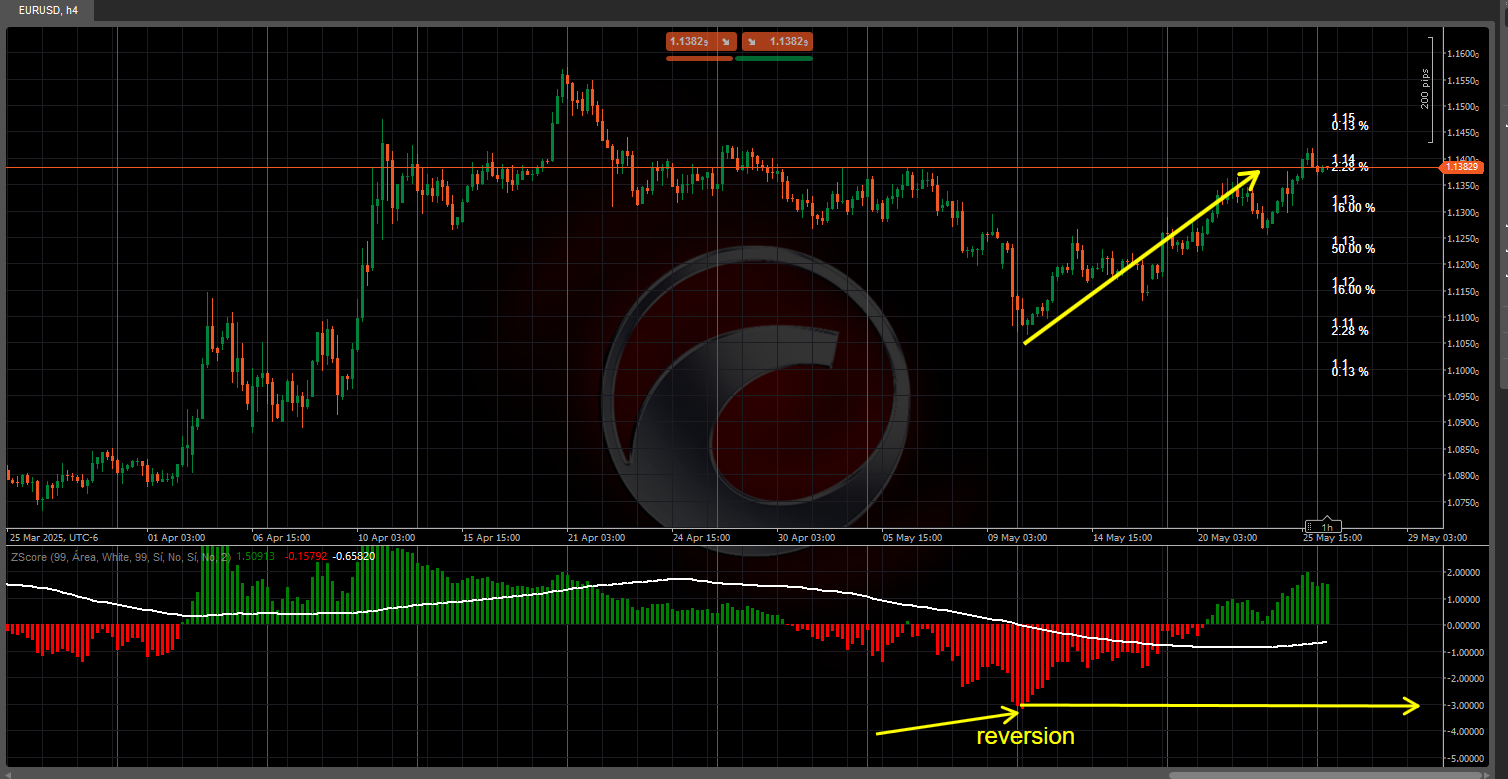
The Z-Score transforms price into a "standard
deviation" scale,
showing how far each candle’s close (or open, high, low) deviates from its
historical mean. With an intuitive visual, it helps identify overbought/oversold
conditions and
high-probability reversal zones! 🔄
1️⃣ What Does It Do?
🔹 Standardizes Price: Converts the absolute closing value into a Z-Score—how many standard deviations it is from the mean
of the last N bars.
🔹 Highlights
Statistical Extremes: Values
near ±1, ±2, or ±3 indicate rarity in price movement:
- ±1 SD (≈ 68% probability between –1 and 1)
- ±2 SD (≈ 95% probability between –2 and 2)
- ±3 SD (≈ 99.7% probability between –3 and 3)
🔹 Aids
in Mean Reversion Trading:
When Z-Score exceeds ±2 or ±3, the market is in an extreme
zone and tends to
revert toward the mean (zero).
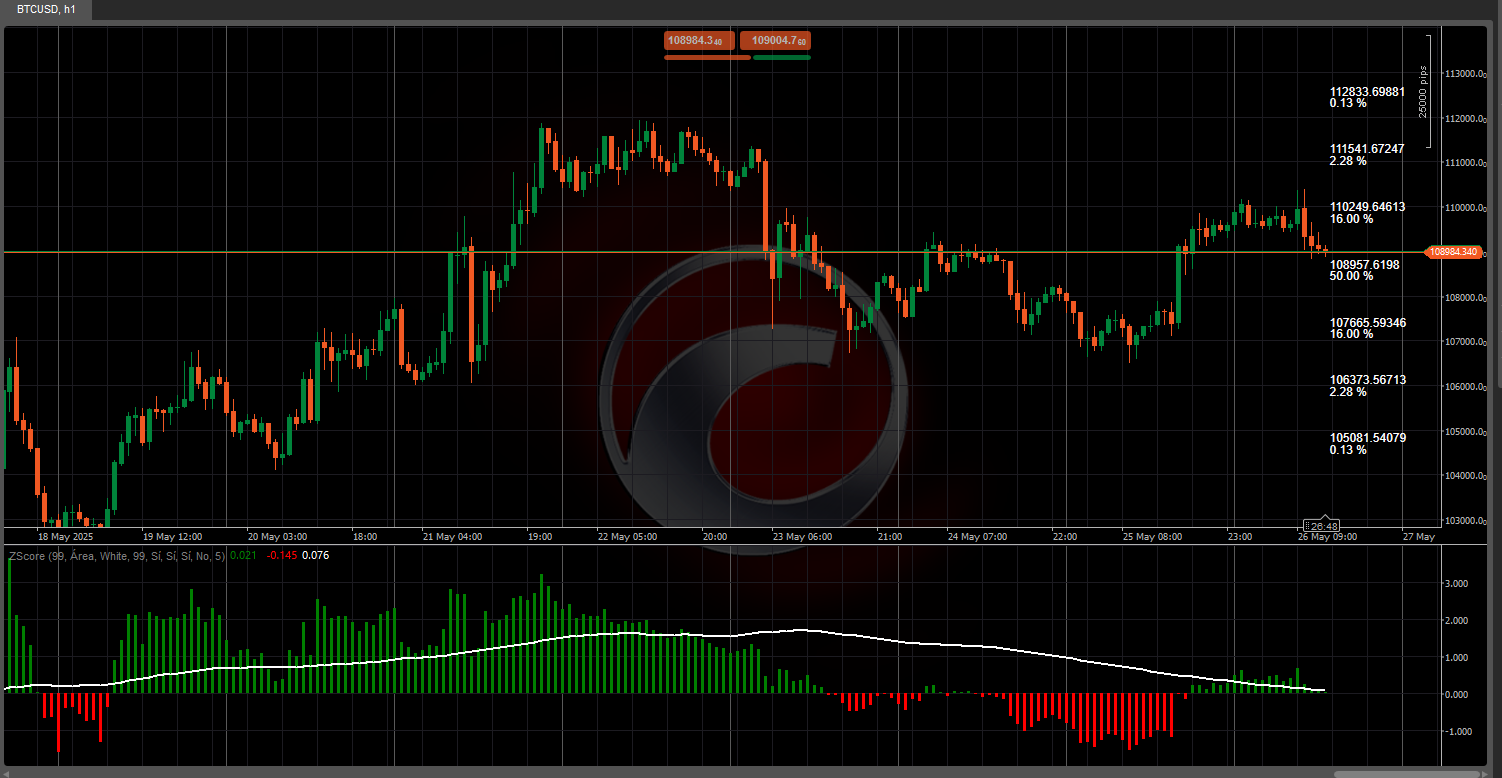
🔹 Clear
Visualization: Using histograms (or special candles), a moving average
line, and colored zones, you can instantly see if price is behaving "normally" or is a statistical
outlier.
2️⃣ How Does It Work?
📐 Calculation of Mean & Standard Deviation
- A lookback
period (e.g., 99
bars) is used. - The mean and standard
deviation (SD) of
closing prices are calculated. - Higher SD = More volatility in price movements.
🧮 Z-Score Formula
Z=Current Close−Historical MeanStandard DeviationZ=Standard DeviationCurrent Close−Historical Mean
- Positive Z → Close above the mean.
- Negative Z → Close below the mean.
📊 Z-Table Probabilities
- Highlights the
current Z-Score’s column to show how rare/extreme the price is!
3️⃣ How to Use It in Trading
✅ Mean Reversion: Look for Z > +2 or Z < –2 to trade reversals (sell overbought
extremes, buy oversold extremes).
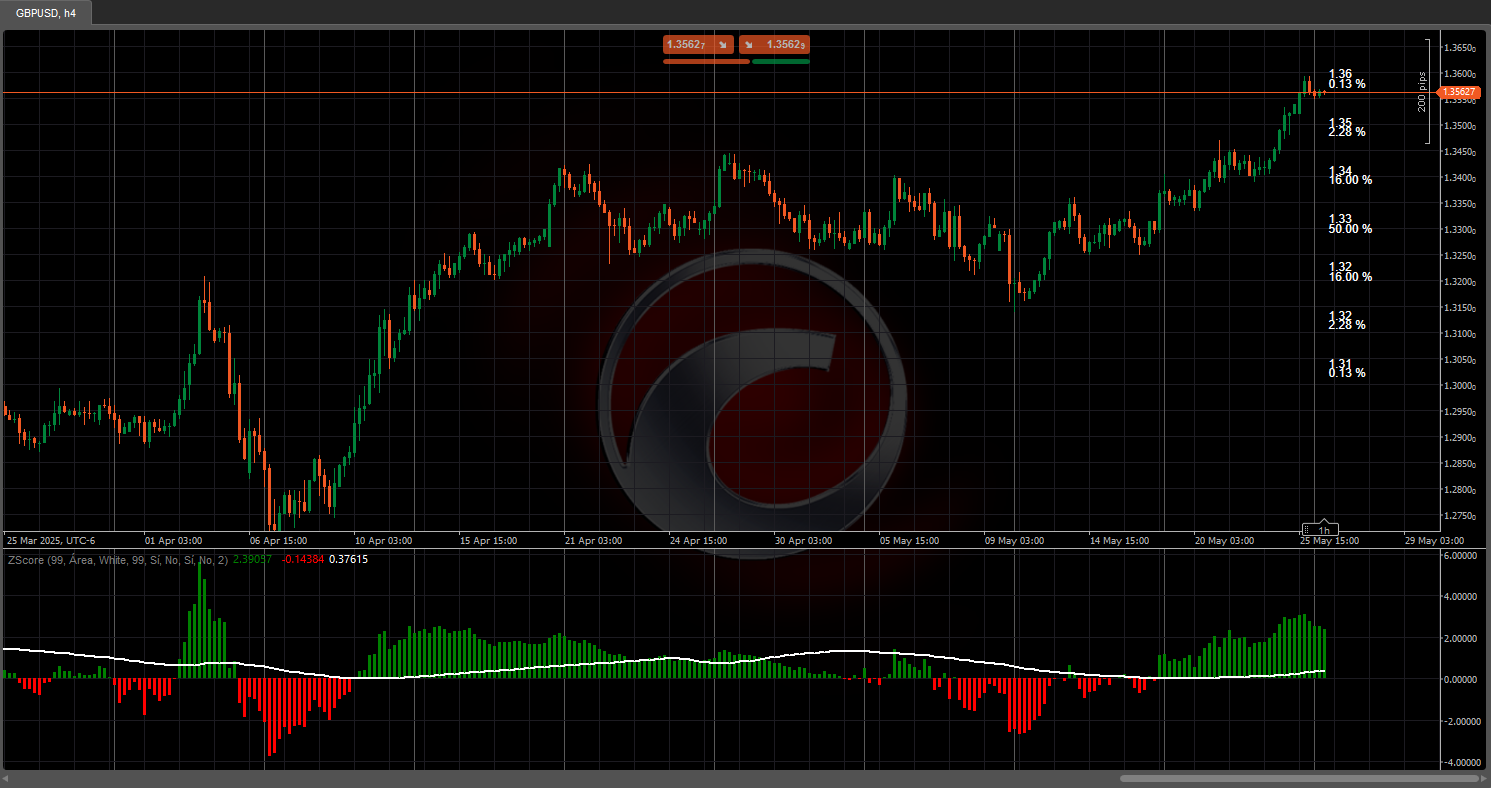
✅ Trend Confirmation: A sustained Z
> 0 + rising moving average signals
strength; Z < 0 + falling MA suggests weakness.
✅ Risk Management: Near ±1 SD, expect normal moves; near ±3
SD, adjust stops &
position sizes carefully.
✅ Entry Timing: Combine extreme Z-Scores with support/resistance
levels for precise
entries.
4️⃣ Pros & Considerations
✔️ Advantages
- Statistical edge in spotting extreme price conditions.
- Multiple display modes (histogram, candles, bands, probability
table). - Easy customization (length, colors, chart type).
⚠️ Considerations:
- In strong
trends, price can stay
"extreme" for long periods without reversing. - Assumes a normal
distribution—may not
work well in highly volatile/skewed markets. - Best used in stable
volatility environments.