Pinescriptlabs Store indicators: Pinescriptlabs Store cBots : (cBot) Gold & BTC BreakoutSession Pivots(new)
PRICE ACTION (New)
Trailing Smart Algorithm (New)
Prediction Based on Linreg & ATR
SmartTrend Support &
Resistance
Lines
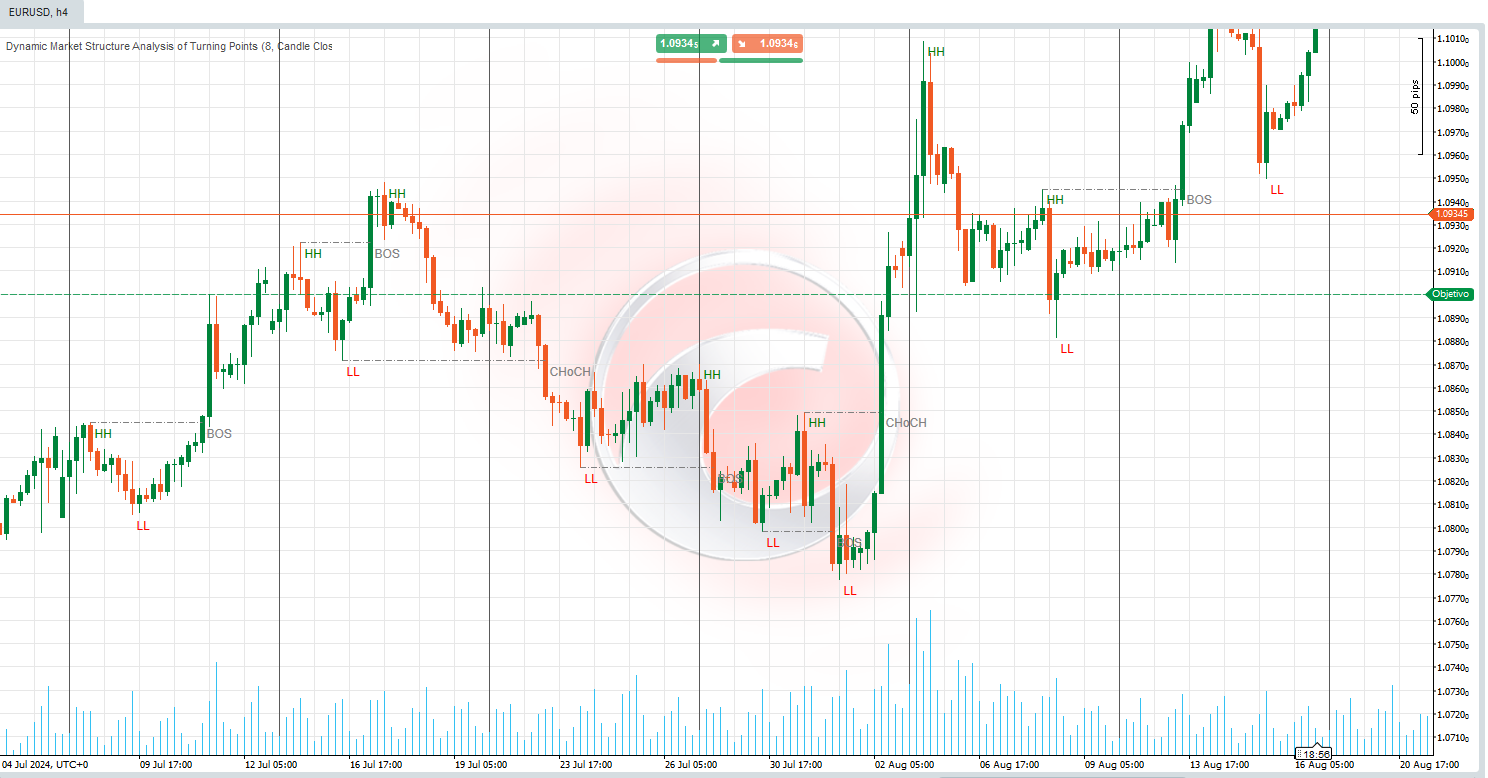
Dynamic
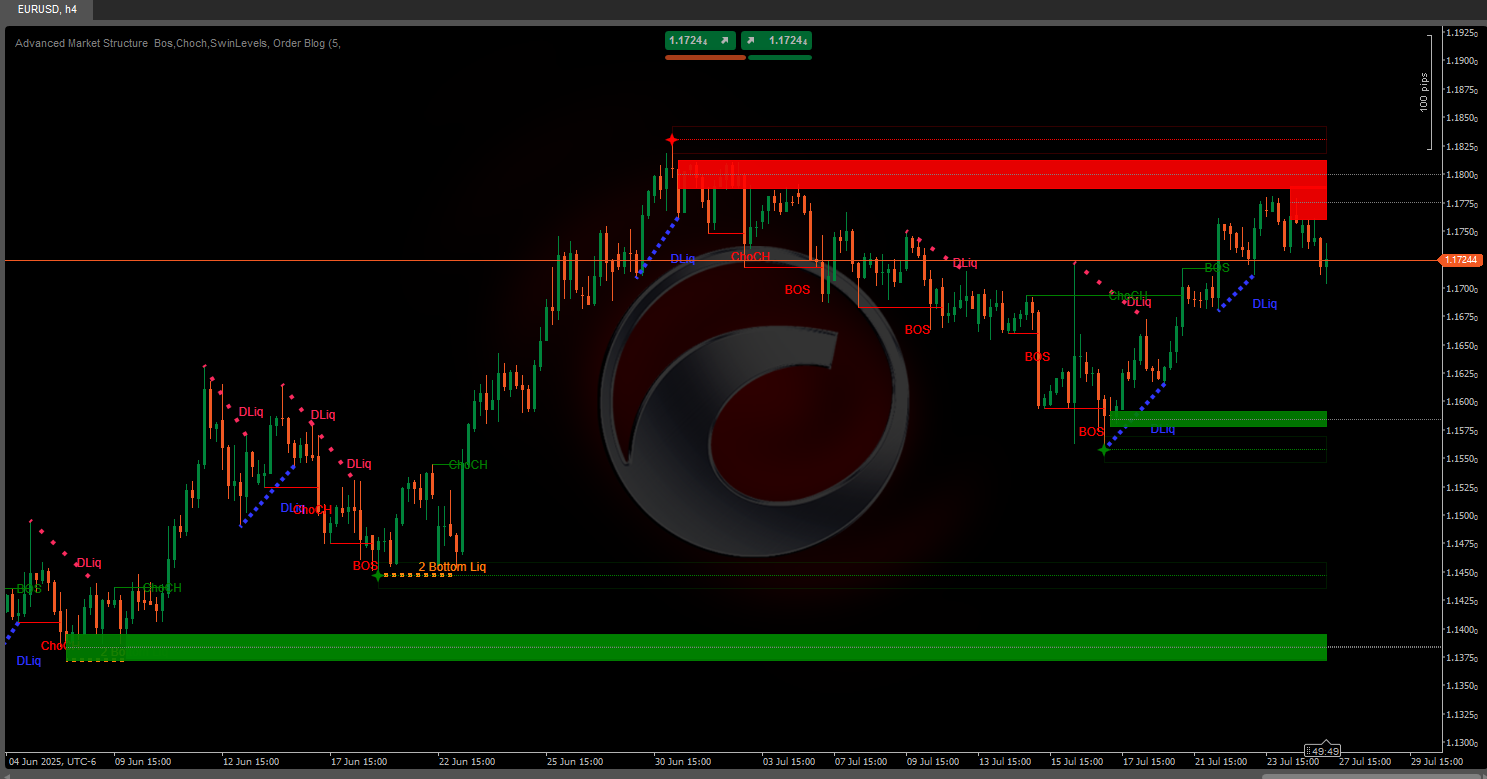
Market Structure
Analysis
of
Turning
Points
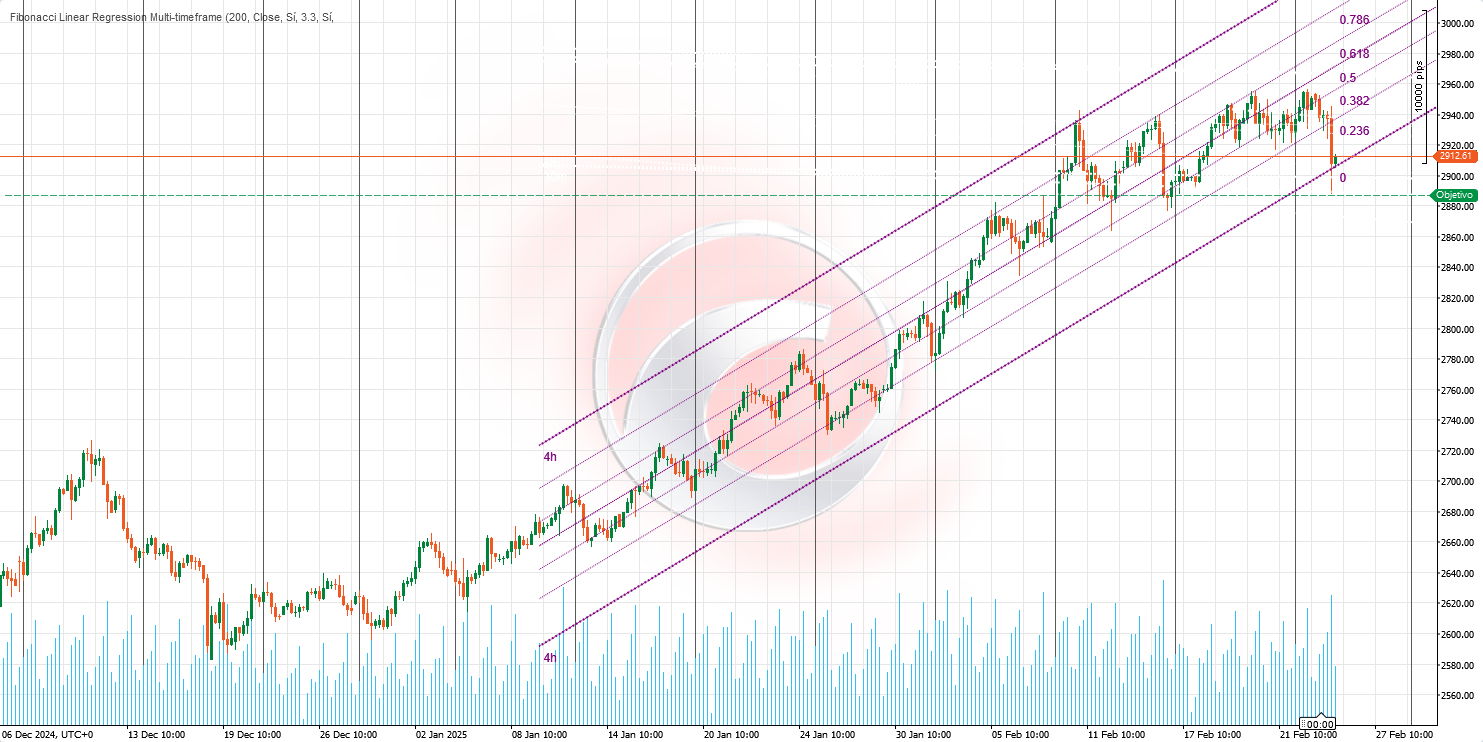
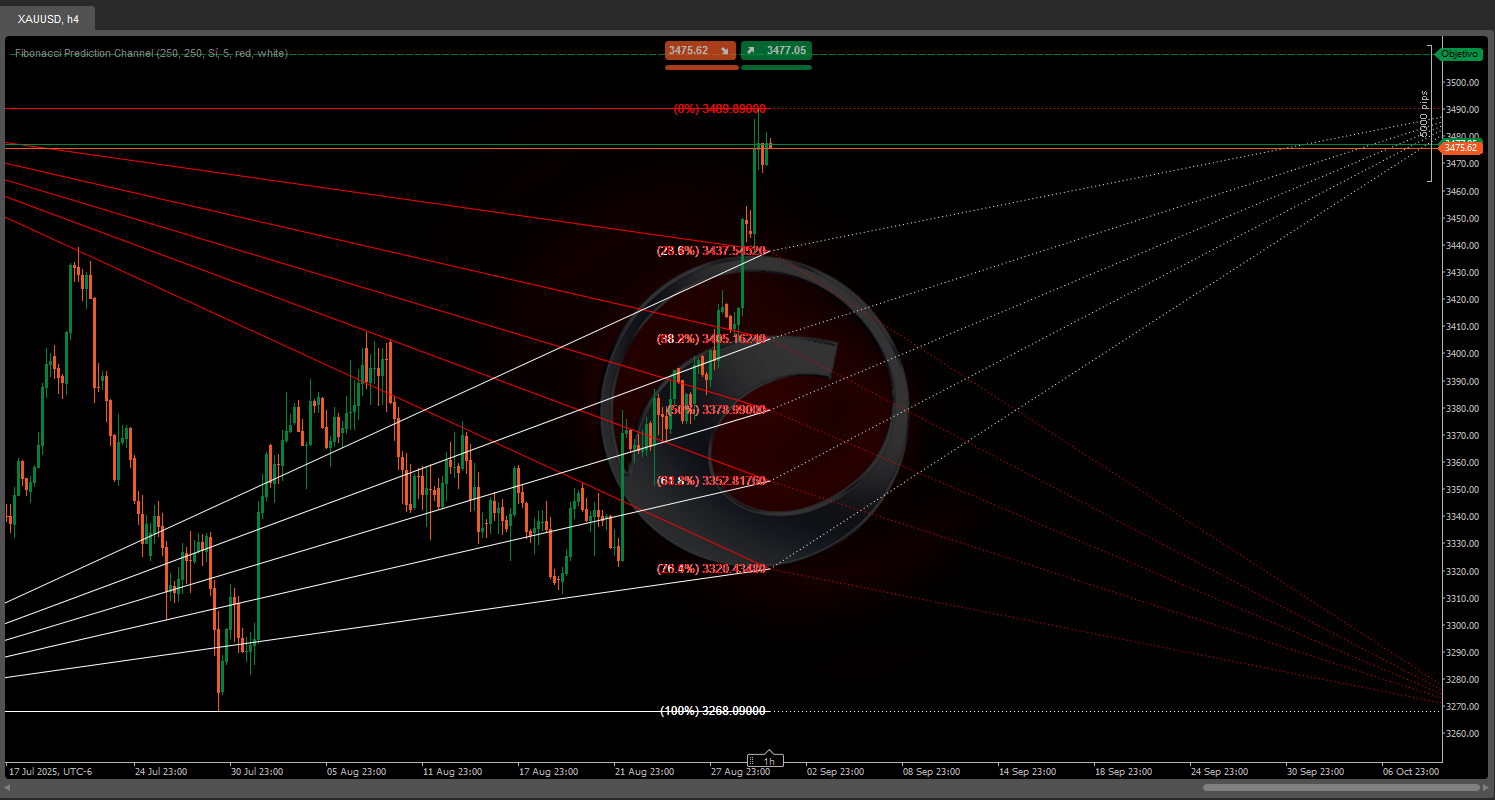
Fibonacci
Linear
Regression
Multi-timeframe
Auto
Support and
Resistance
Trend
Lines
All
Support and
Resistance
Levels
Description:
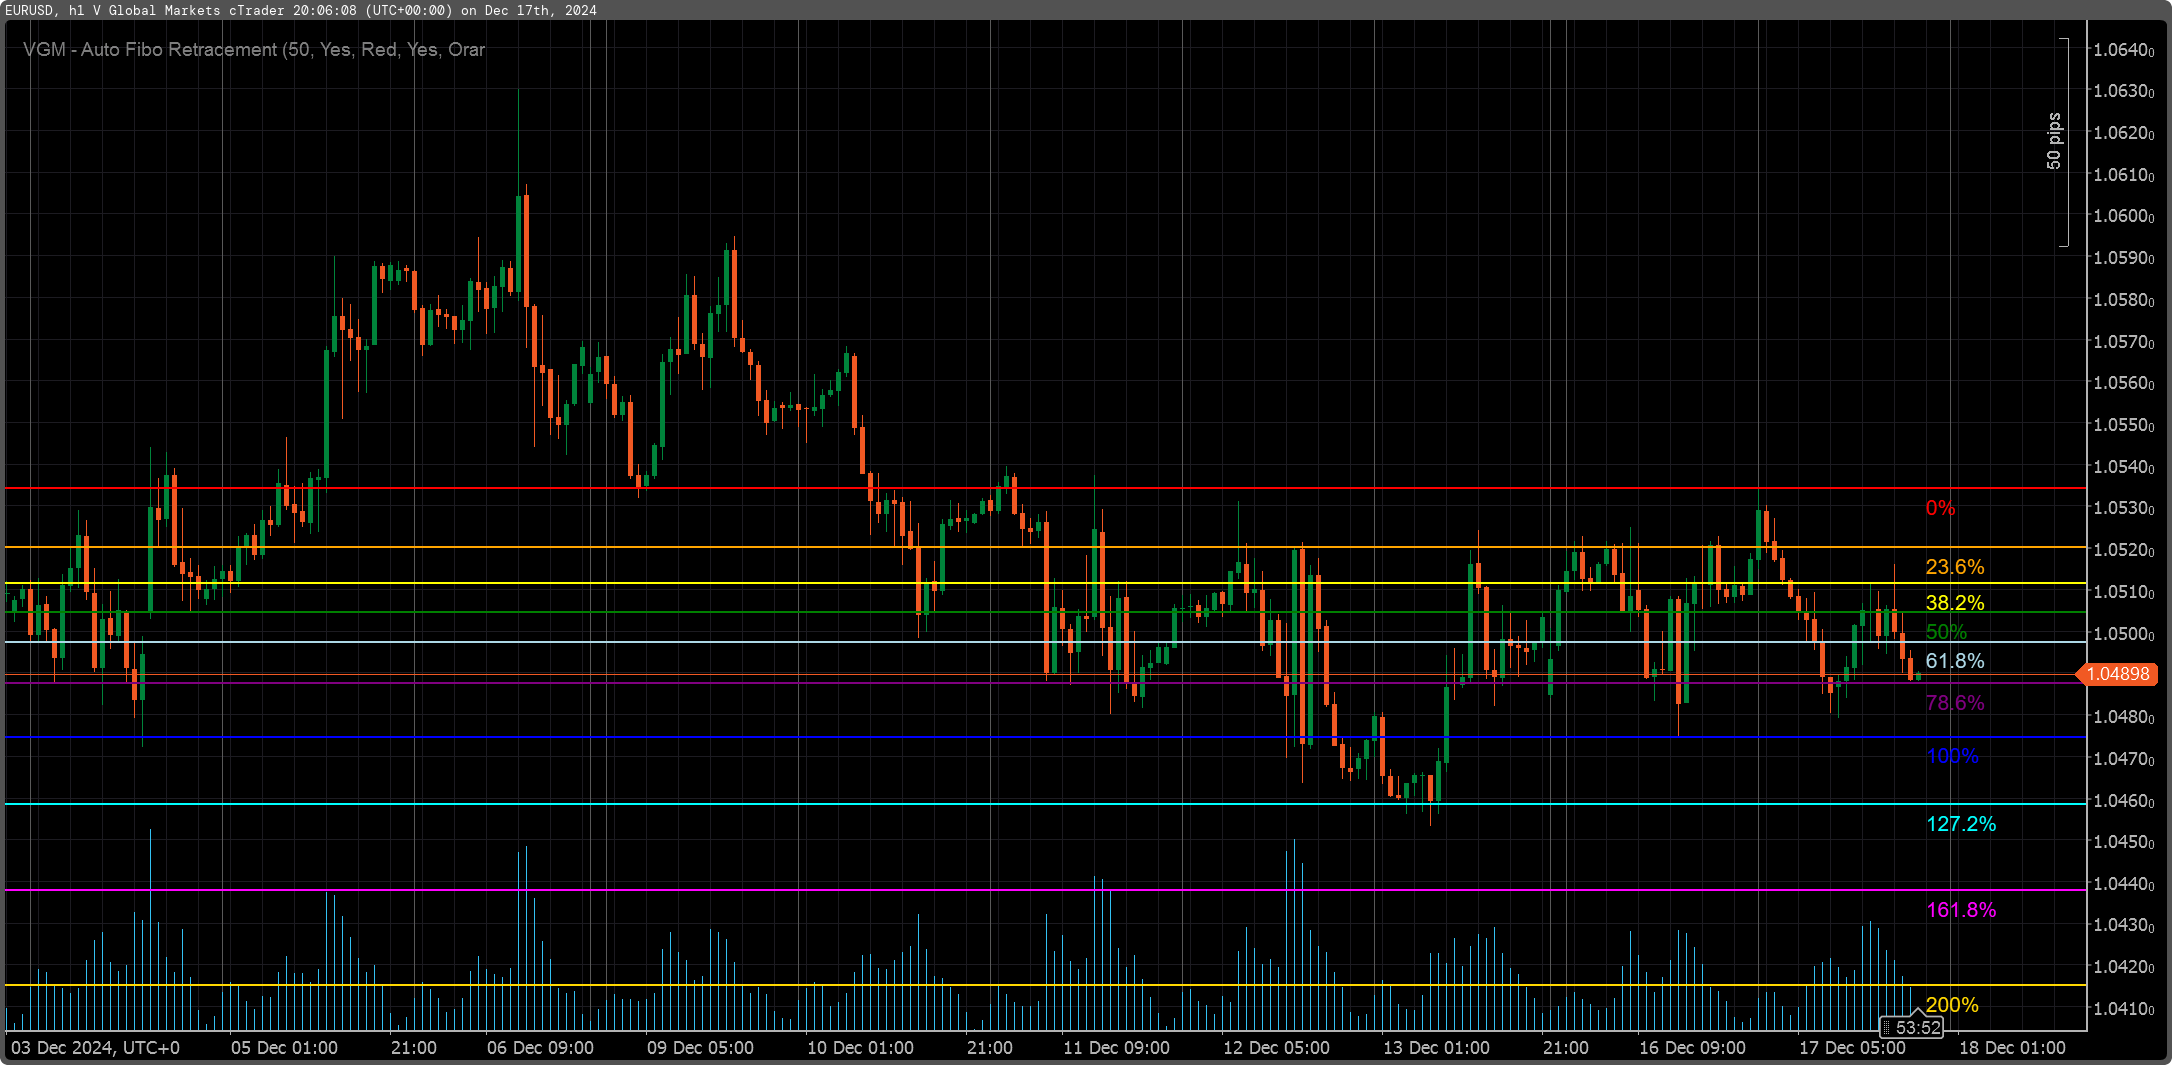
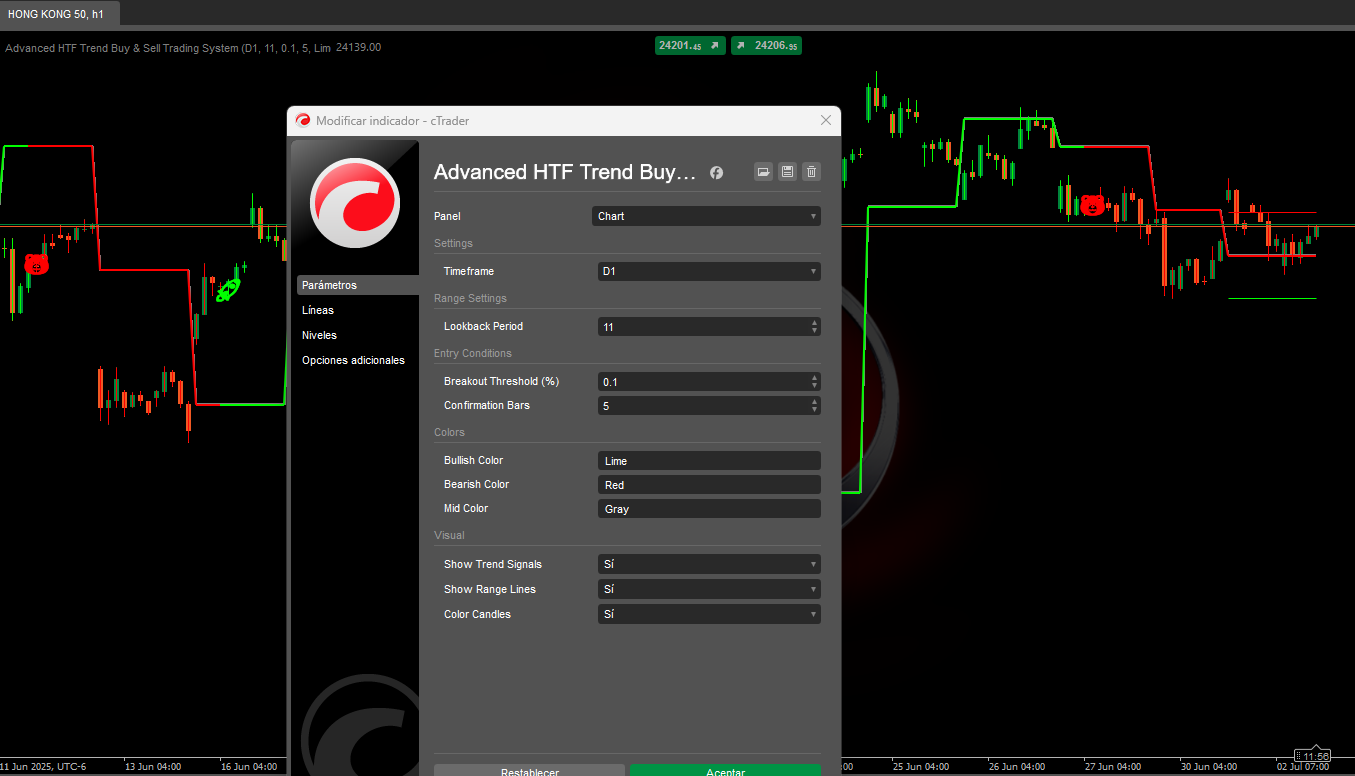
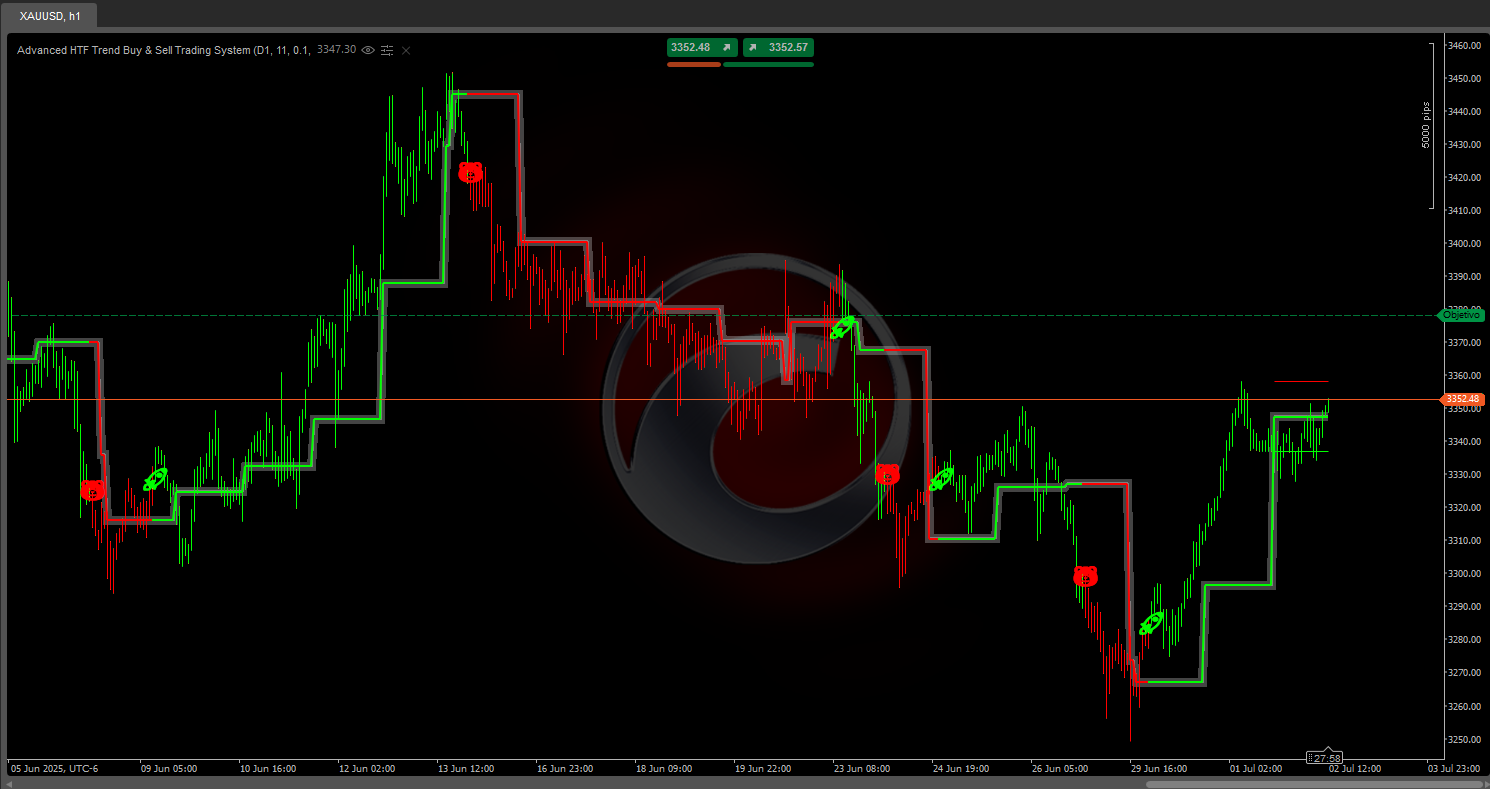
Advance HTF Trend Buy & Sell Trading System
What is it and what is it for?
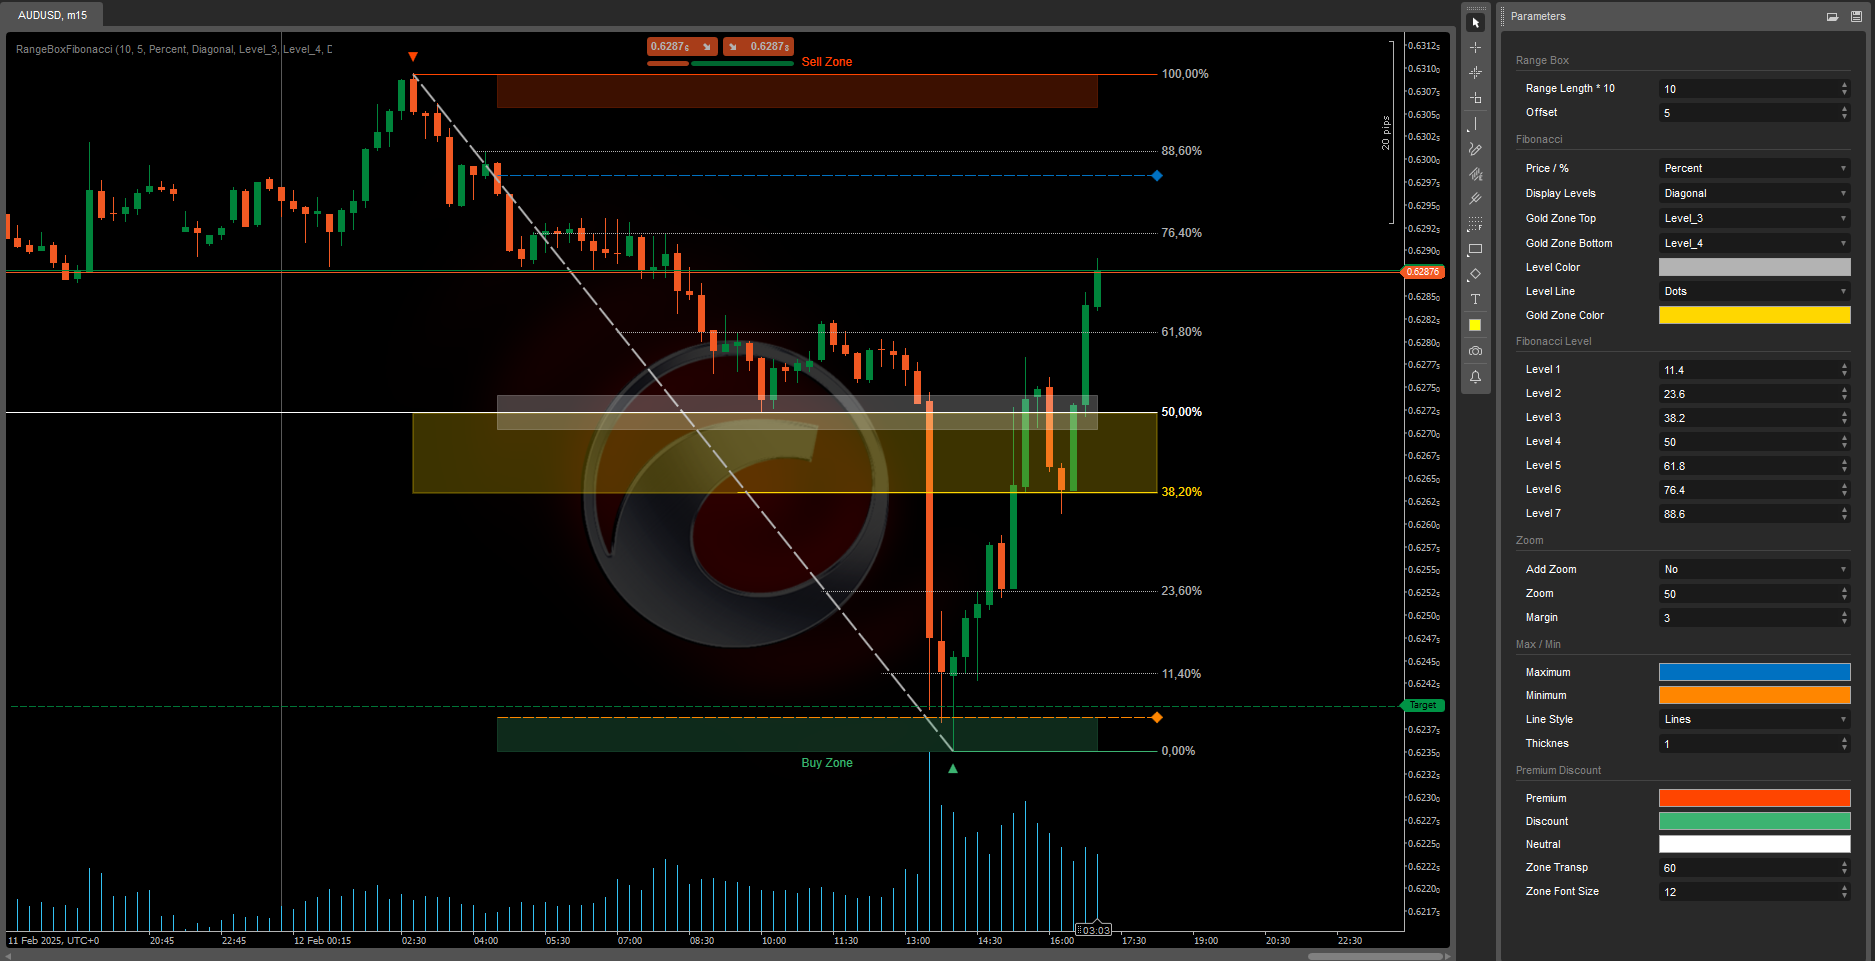
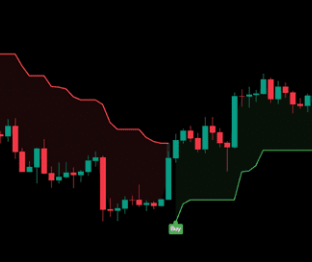
It’s a technical analysis algorithm that automatically identifies support and resistance levels 📈 based on historical price ranges, and detects when price breaks these levels to generate trend signals 💡.
How does the logic work?
1️⃣ Range Calculation
The indicator analyzes a defined historical period (fully configurable) to find:
• The highest price reached in that period 📊
• The lowest price reached in that period 📉
• The midpoint between both levels ⚖️
2️⃣ Level Establishment
Once the extremes are identified, the indicator:
• Draws a red line at the maximum level (resistance)
• Draws a green line at the minimum level (support)
• Adds a safety buffer to each level to prevent false signals 🛡️
3️⃣ Breakout Detection
The system constantly monitors the price to detect:
• Bullish breakout 🚀: when the price closes above the resistance level + buffer
• Bearish breakout 🐻: when the price closes below the support level - buffer
4️⃣ Confirmation System
Before generating a final signal ✅, the indicator:
• Waits for a configurable number of consecutive bars confirming the breakout ⏳
• Only after confirmation does it officially change the trend
5️⃣ Dynamic Updating
Levels are recalculated automatically:
• When a new period starts (daily, weekly, or monthly, depending on your settings) 🔄
• Lines extend until new levels are set
• The midpoint line changes color according to the current trend
How to Use the ?
✨ Signals:
• Buy: The 🚀 symbol appears when a bullish breakout is confirmed
• Sell: The 🐻 symbol appears when a bearish breakout is confirmed
🎨 Candle Coloring:
• Candles are automatically colored according to the current trend:
✅ Green: Active bullish trend
❌ Red: Active bearish trend
Parameter Settings
🔧 Lookback Period (5–200, default: 11)
What does it control?
The number of historical bars used to calculate highs and lows.
Impact when modified:
• Low values (5–15):
- More reactive and frequent levels
- Higher number of signals
- Best for scalping and short-term trades
- Ideal for highly volatile markets
• High values (30–50):
- More stable and lasting levels 🏛️
- Fewer but more reliable signals
- Better for swing trading and medium-term positions
- Ideal for more stable markets
📏 Breakout Threshold (0.01–5.0%, default: 0.1%)
What does it control?
The extra buffer the price must exceed to confirm a breakout.
Impact when modified:
• Low values (0.05–0.15%):
- Earlier and more sensitive signals 🔍
- Higher risk of false breakouts
- Ideal for Forex majors with low spreads
- Best for high liquidity markets
• High values (0.3–1.0%):
- Later but more reliable signals 🛡️
- Lower risk of market noise
- Ideal for cryptocurrencies and volatile assets
- Best for markets with wider spreads
⏳ Confirmation Bars (1–5, default: 1)
What does it control?
How many consecutive bars must confirm the breakout before generating a signal.
Impact when modified:
• 1 bar:
- Instant signals ⚡
- More trading opportunities
- Higher risk of premature signals
- Ideal for active traders
• 2–3 bars:
- Balance between speed and reliability ⚖️
- Significantly reduces false signals
- Ideal for most strategies
• 4–5 bars:
- Very conservative signals 🕊️
- Maximum reliability
- May miss early opportunities
- Ideal for long-term positions
📊 Optimization by Asset Type
💱 Forex Majors (EUR/USD, GBP/USD, etc.)
• Lookback: 15–25
• Threshold: 0.05–0.15%
• Confirmation: 1–2 bars
💰 Cryptocurrencies
• Lookback: 10–20
• Threshold: 0.2–0.8%
• Confirmation: 2–3 bars
📈 Stock Indices
• Lookback: 20–30
• Threshold: 0.1–0.3%
• Confirmation: 1–2 bars
🌾 Commodities
• Lookback: 25–35
• Threshold: 0.15–0.4%
• Confirmation: 2–3 bars
Considerations
• May generate late signals in very fast-moving markets 🏃♂️
• Less effective in extremely sideways markets
• Requires parameter adjustments depending on asset and timeframe ⏱️


.png)
.jpg)

.jpeg)